Documentation about the SVOM Support Tool for Observations Mission Planning
Presentation of the tool
SSTOMP stands for SVOM Support Tool for Observations Mission Planning
This web application has been developed for the SVOM Mission in order to help any user of the SVOM system to define and tune an observation request in order to roughly establish its validity in view to propose it then to the operational system within either the framework of the General Program or as a Target of Opportunity. It can also be used to support the test and commissionning phases and potentially, to help to investigate some particular cases occurring during flight.
The SSTOMP tool aims to provide multiple results to understand the constraints applied to an observation at a given date or over a time period. Strictly speaking, SSTOMP is not an operational tool of the SVOM Mission and it has no direct link with the operational system but it is based on representative and up-to-date static data and parameters allowing for a good estimate of the behaviour of the operational system.
SSTOMP was developed by CNES, initially during three internships supervised by Jean JAUBERT (DTN/DV/PGS department), and then is maintained under the supervision of the CNES system team.

General Information
All tools include various boxes for defining input parameters and values. The main ones or those shared by several tools are the following :
The mission parameters box
Firstly, there is a switch to alternate between the two modes available for the application to define the mission parameters of SVOM. Just click on the central slider to switch between the two modes.

In the automatic mode, you are not required to provide SVOM mission parameters. By default, the application uses the SVOM reference mission parameters.

In the manual mode, you are required to provide your own mission parameters file.
This allows you so to provide mission parameters that you manage and control (for instance, to perform analysis in line with specific test scenarios or alternative tunings, ...).
In this mode, a template file is proposed and is downloadable to be fulfilled as desired. This template file contains the reference values of system and mission parameters (used in automatic mode).
Important note : if the content of a mission parameters file is updated while it is chosen/selected for manual mode, you have to select it again before launching computation.

The orbital parameters box
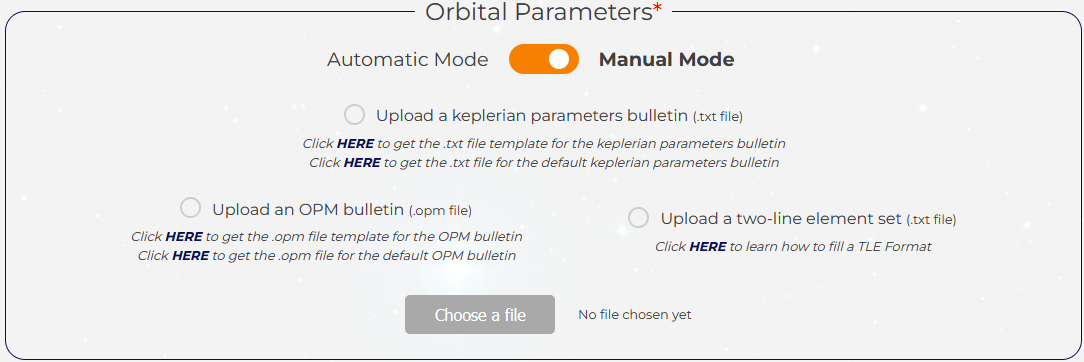
Firstly, there is a switch to alternate between the two modes available for the application to define the orbit of SVOM. Just click on the central slider to switch between the two modes.

In the automatic mode, you are not required to provide orbital parameters. Instead, the application automatically retrieves and uses the orbital data from the SpaceTrack website dynamic database by picking the latest 2-lines elements (TLE) bulletin available for the SVOM satellite. You can also download the TLE data file that has been retrieved.

In the manual mode, you are first required to choose a type of orbital parameters. You can either provide a bulletin with standard keplerian parameters (following a template that can be downloaded),
or you can use a OPM bulletin with osculator keplerian parameters (following a template that can be downloaded), or a TLE dataset by following the format expected for TLE bulletin (see SpaceTrack website).
This allows you so to provide orbit parameters that you control (coming from external sources like scenarios for system tests, operational data, ...).
In case you do not dispose of any orbital data, there is the possibility to use the default bulletin proposed (by downloading it first and then choosing it) which contains representative orbital parameters (compatible with system requirements) at
a predefined date for SVOM (that can be modified if needed to cope with a given time period).
Important note : The orbit propagation is performed with analytical models (SGP4 for TLE, Eckstein-Hechler for OPM and keplerian bulletins). The accuracy and even validity
of the extrapolated orbit is ensured over a period of a few weeks with TLE and SGP4 model. For OPM and keplerian bulletins and Eckstein-Hechler model, this period is longer
(a few months). However, the shorter the time between orbit parameters and period of computation, the better the accuracy.
The instruments selection box
The observation of a target can be made using different instruments on-board the SVOM satellite. Each instrument has
its own set of constraints associated which will impact the observability of a given sky target. These constraints relates to celestial bodies avoidance
(Sun, Moon, Earth limb) and also to South-Atlantic Anomaly (SAA) crossings with values (for margins, area definition, ...) being those defined at system level. You must select at least one instrument
but you can also select several ones. This will result in defining the set of constraints to be used for the computation of the feasibility and features of the
observation. In case of multiple instruments selected, the worst case constraints will be taken into account.
Note 1 : the spacecraft general constraint with respect to the Sun is always considered by default, whatever the instruments choice.
Note 2 : the selection of instruments doesn't impact the line of sight (LOS) considered to compute the pointing towards the
sky target chosen. The LOS taken into account is always the X axis of the satellite reference frame.

The target observation box
This box corresponds to the information needed to define the target observation itself. You must provide at least four input data
that describe the requested observation: the target direction by giving the right ascension and declination angles in the J2000 reference frame, the date or the start
and end dates of the period (if the "time period" option is selected) to be analysed. If no time indication is fulfilled, the default time is 00:00:00. Moreover, the default
time scale used is the UTC (being the reference for the SVOM system) but you can select the TAI option if preferred.
Futhermore, you can select a target observation among predefined targets corresponding to known sources.
Besides those fields, you can also provide a required duration for the observation. This corresponds to the effective cumulative observing time that is wished (i.e. useful time without any
constraint applying) and this will lead to the production of additional results associated indicating if this duration can be ensured or not over the chosen period.
Finally, you can specify your own computation time step, different from the default 300 seconds.

A special attention needs to be paid to the time step value. This time step is important as it defines the sampling of the orbit propagated and so, the sampling and accuracy of most of the results computed and then returned to the user (e.g. constraints are only evaluated at sampled dates, numerical results or charts are sampled according to this time step). Having a low value of the time step will produce more accurate results but will usually require a long computation time, especially if the period chosen is extended. That is why it can be recommended to use initially a high time step when you want to scout a long period of time, and then, by analysing the rough results returned, to refine those results by choosing a shorter period with a smaller time step in order to have more accurate results and charts.
Observation with VT, MXT, ECLAIRs
This tool is the main functionality of SSTOMP. It has been designed to provide diverse information about the feasibility and features of a basic observation of a sky target source requested by the user and performed by one or several instruments among VT, MXT and ECLAIRs.
The inputs
The inputs of the form first consist of the three general boxes described in the General Information panel. As explained, the user has the option of switching between an "instant mode" (default choice) and a "period mode". The instant mode provides results at one chosen date defined only by the start date and time fields. On the contrary, the period mode provides information on a period of time delimited by the start and end dates fields, sampled according to the time step assigned. You can activate this mode by just clicking on the option in the target observation box. The content and presentation of the results computed and returned will be slightly different depending on the mode selected.

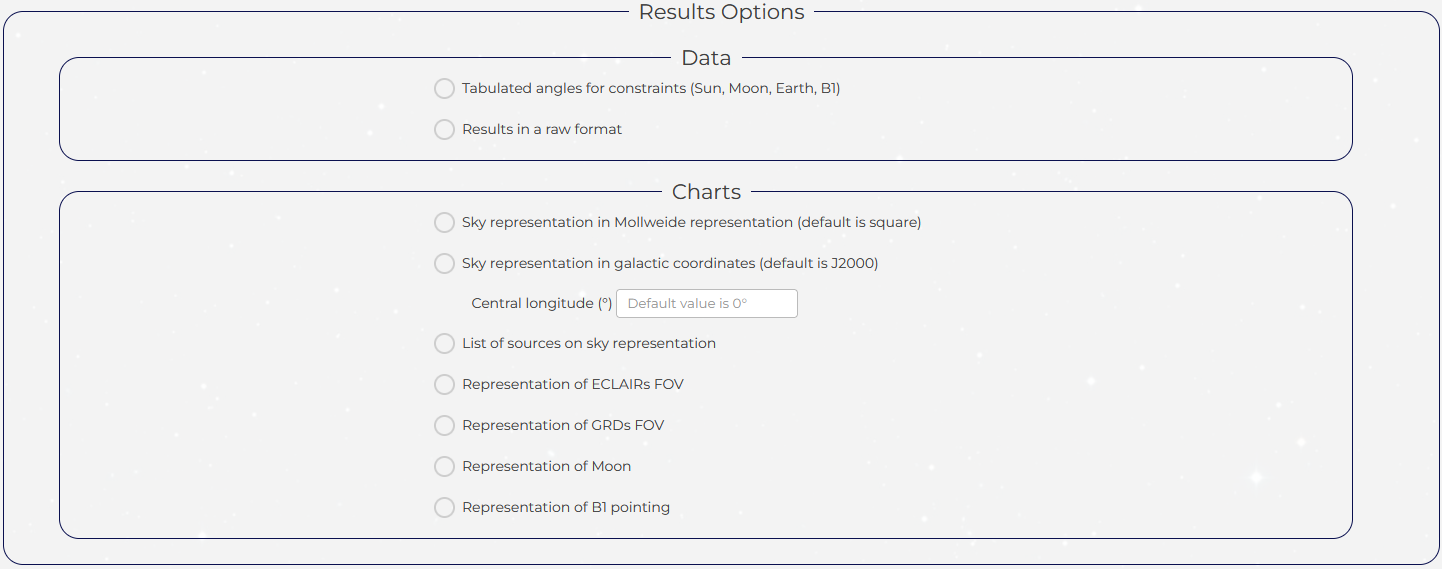
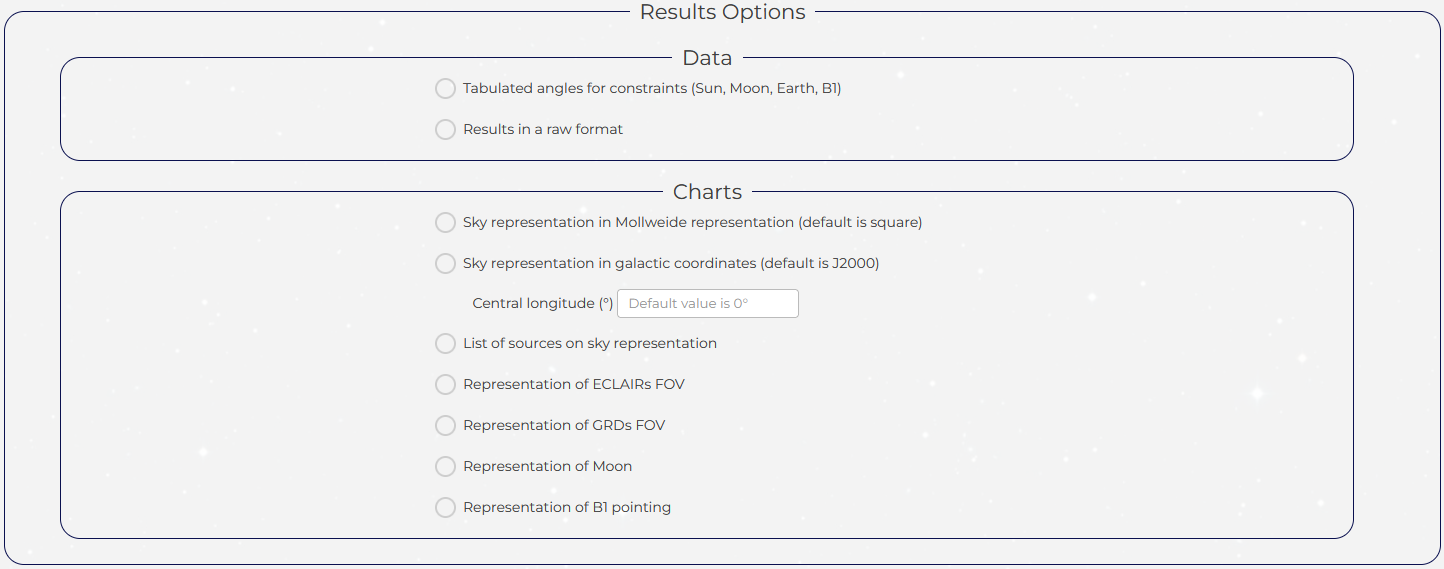
There is also another box in the form associated to the main tool: the Result Options. Indeed, to supplement
the basic essential results, you can choose to compute and get or not some additional results proposed by this function of the SSTOMP tool. The choices are relatively
straightforward and divided into two main parts, one for data and one for graphic representations and charts. Some choices will lead to display new boxes and forms to get
the related inputs needed from the user (see further).
If the option “central longitude” is filled, maps produced are centered on this specific longitude. By default, central longitude is 0°.
The longitude indicated implicitly refers to the chosen frame, J2000 or galactic.
Note : for data, the user has the option of being provided with results in a "raw format". This means that the results produced
in text files will not be formatted (with titles, tables and field names) in order to allow for an easier use with other applications if needed.
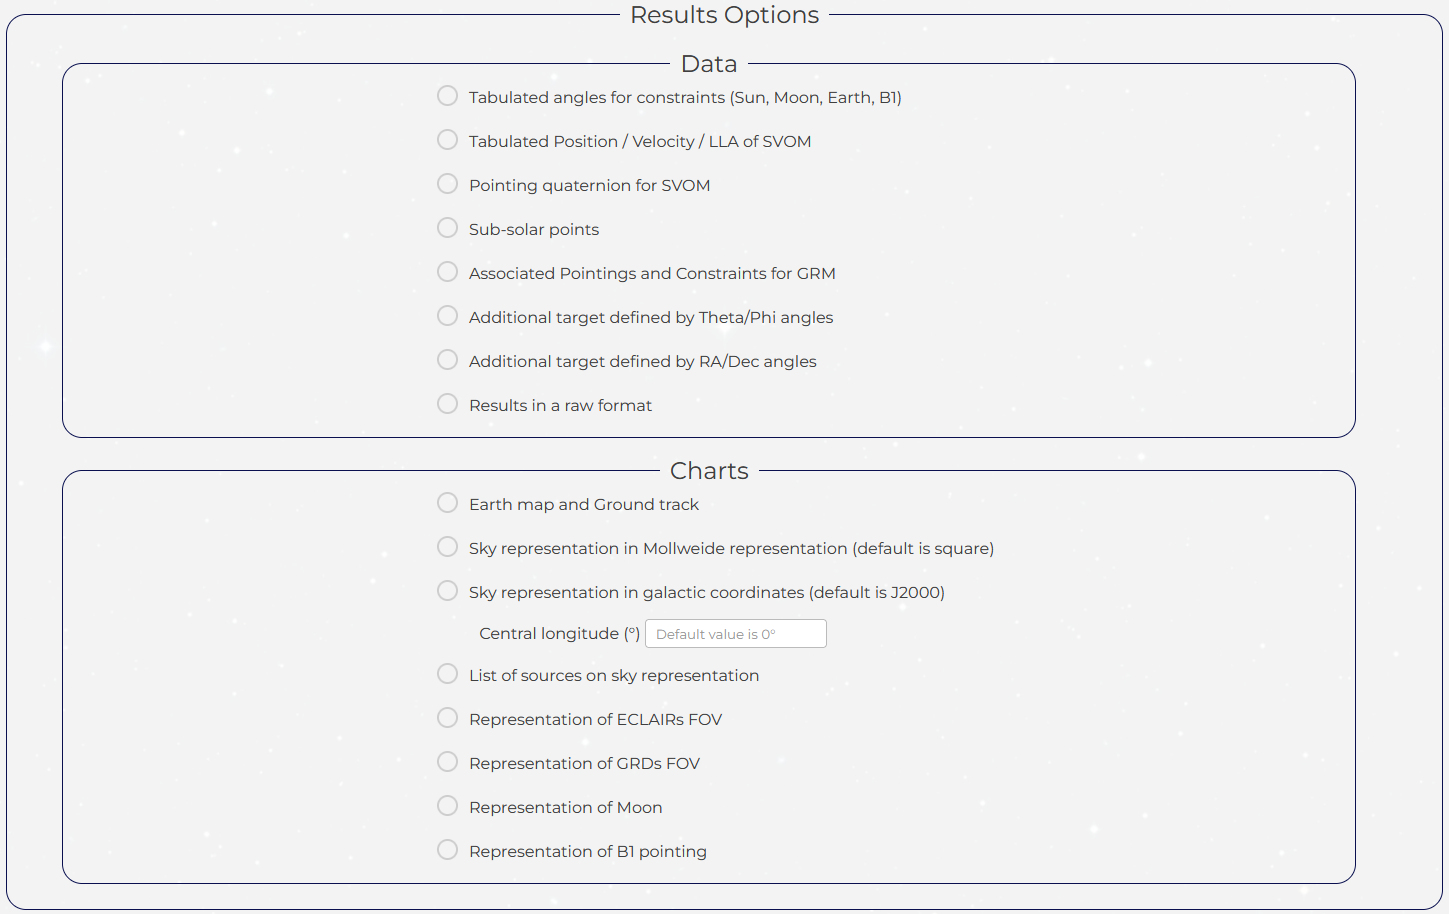
If the option "Pointing quaternion for SVOM" is chosen and if no period has been entered (all computations at one single date), SSTOMP computes the quaternion at the selected date.
If the option "Pointing quaternion for SVOM" is chosen and if a time period has been previously entered, a dedicated form has been implemented with the purpose to let the user compute the SVOM quaternion at a given date :
There are three predefined dates proposed (start date, middle date, end date of the period) and one specific choice that allows the user to enter a date that can be any.
If the option "Pointing quaternion for SVOM" is not chosen and if a time period has been previously entered, middle date of period is used for internal computations.

If the option is chosen, a dedicated form has been implemented with the purpose to let the user select the list of sky sources to be displayed on sky charts with two modes available : The default automatic mode proposes some default lists of sources associated each to an instrument and that you can browse by clicking on the "Here" button. The other mode which is the manual one allows you to download a template and then, to enter your own list of sources with the "Choose a file" button.

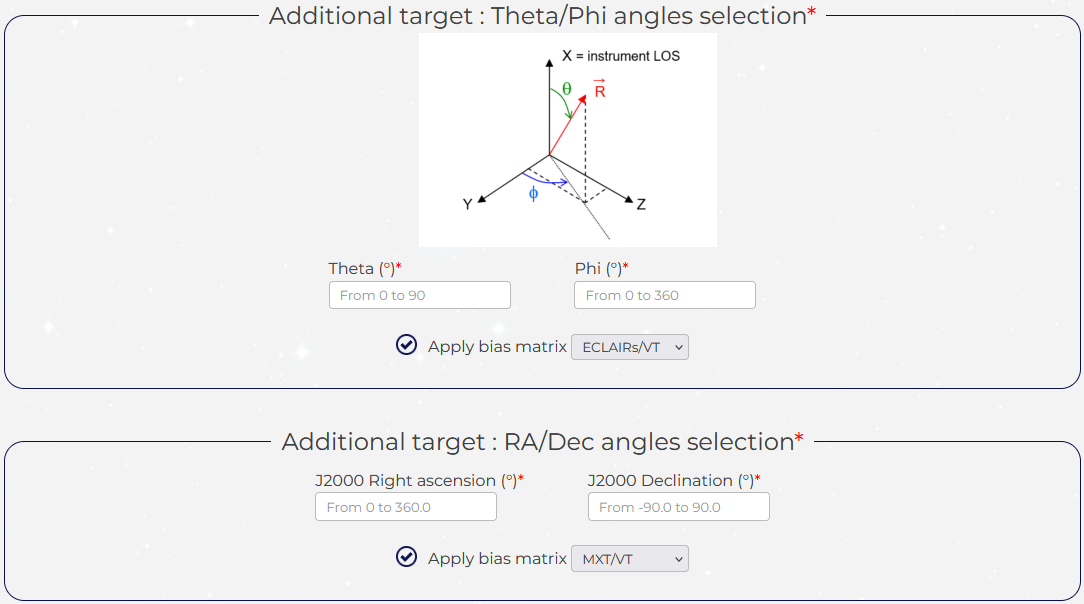
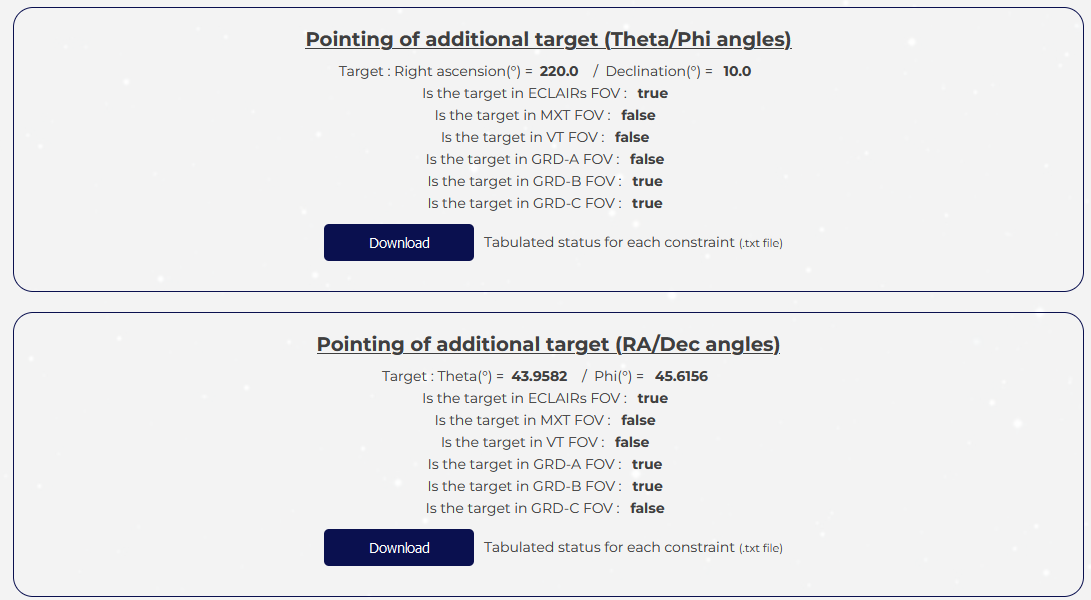
If the options have been chosen, dedicated forms have been implemented with the purpose to let the user define two additional sky targets with two different methods.
The Theta/Phi method which allows the user to define coordinates directly in with the two angles Theta and Phi as defined at system level and recalled on the presented scheme.
The RA/Dec method which allows the user to define a target by her coordinates directly in the J2000 equatorial frame.
The satellite frame is supposed to be also the LOS frame of any instrument among ECLAIRs, MXT, VT unless a specific bias matrix is selected.
Note : For these optional additional targets,
- The user can also select the bias matrix he wants to be applied to represent the LOS frame to be considered and linked to the Theta/Phi angles taken into account or computed (and also for the definition of FOV of each instrument). Two predefined bias matrices are proposed (VT/ECLAIRs or VT/MXT). The definition of these matrices is given in the SSTOMP general parameters file. Note that the choice of the matrix is independent of the initial choice of the instrument for definition of associated constraints to be checked.
- If the option of computing associated pointings for GRM/GRD has been activated, a dedicated selection box allows the user for choosing the consideration of bias matrices associated to GRD LOS frames.
- Some results are produced regarding the pointing direction (RA/Dec or Theta/Phi alternative coordinates associated) including the status of constraints sampled over the chosen period.
Note : The applicable Sun constraint remains attached to the X axis of the satellite frame pointing towards the main target source defined. Nevertheless, the angle between Sun direction and additional target direction is computed and indicated in the detailed results provided in text files.
If the "Pointings and constraints for GRM" option has been chosen, dedicated form has been implemented with the purpose to let the user apply GRM bias matrices.

The results
There are two types of results produced after computation in this section of SSTOMP: the essential ones which will always be displayed and the optional ones which will be computed and displayed depending on the user's selection.
The essential results are:
The instruments constraints. For each type of constraint, the box indicates the instrument giving the worst case value which is then taken into account for the observability analysis.

The target observability. In the "instant mode", the box shows the flags corresponding to the status (met/not met) of each constraint computed at the requested date and time.

In the "period mode", the tool displays a table listing the intervals when effective observation is possible (i.e. without any constraint) between the start and end dates of the chosen global period.
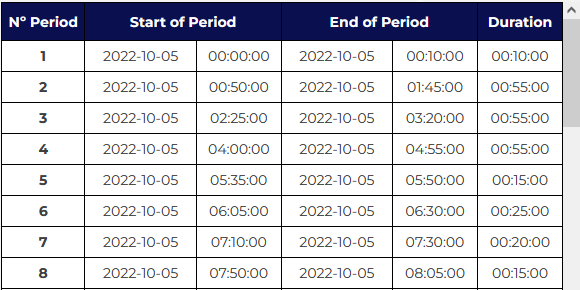
And in both cases, it proposes to download the results as a text file containing the status of each constraint at every sampled date and supplemented with angular values associated. Depending on the user's choice, this text file can be formatted or not (raw results option activated).
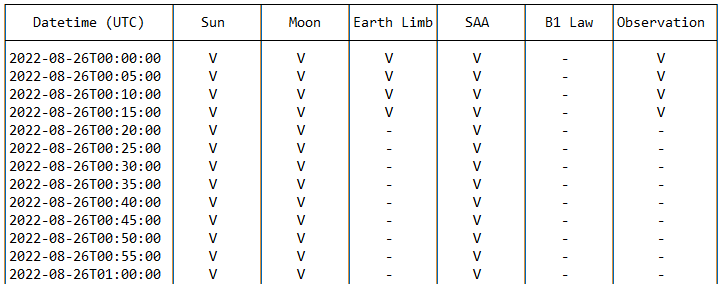
The additional results. This part includes several information such as the mean availability of the target over the year (from a predefined table and only depending on the pointing direction). In "instant mode", it indicates the compatibility with the B1 Law (less than 10.0° from the B1 pointing at the date) and in the "period mode", it shows the mean availability of the target computed this time, over the period requested. If a wished effective observation duration was filled out, it also calculates the effective duration obtained over the period and the estimated minimum number of orbits that would be necessary to have the requested effective observation duration (from the mean availability measured over the period).
Note : as a reminder, the availability is defined as the ratio between the cumulative duration of all intervals when effective observation is possible and the total duration of the period.
The sky representation. This section will show you visually the chosen target source on a sky map in various coordinates systems (equatorial J2000, galactic) and projections (rectangular, Mollweide) depending on the different results options you have chosen. Other information can also be represented on this chart as galactic plane, orbit plane and poles, Sun and Moon positions, ECLAIRs FOV, GRD pointings and FOV, additional sky sources and targets, B1 pointing. The corresponding image can be downloaded. In the representation of the sky chart, J2000 Right ascensions or galactic longitudes are indicated from positive values on the left to negative values on the right in order to correspond to the natural observing view of the sky from Earth
Note: Some elements are represented either at the unique selected date or middle date of period or selected date for the quaternion depending on the options chosen. Moon position is sampled over the period.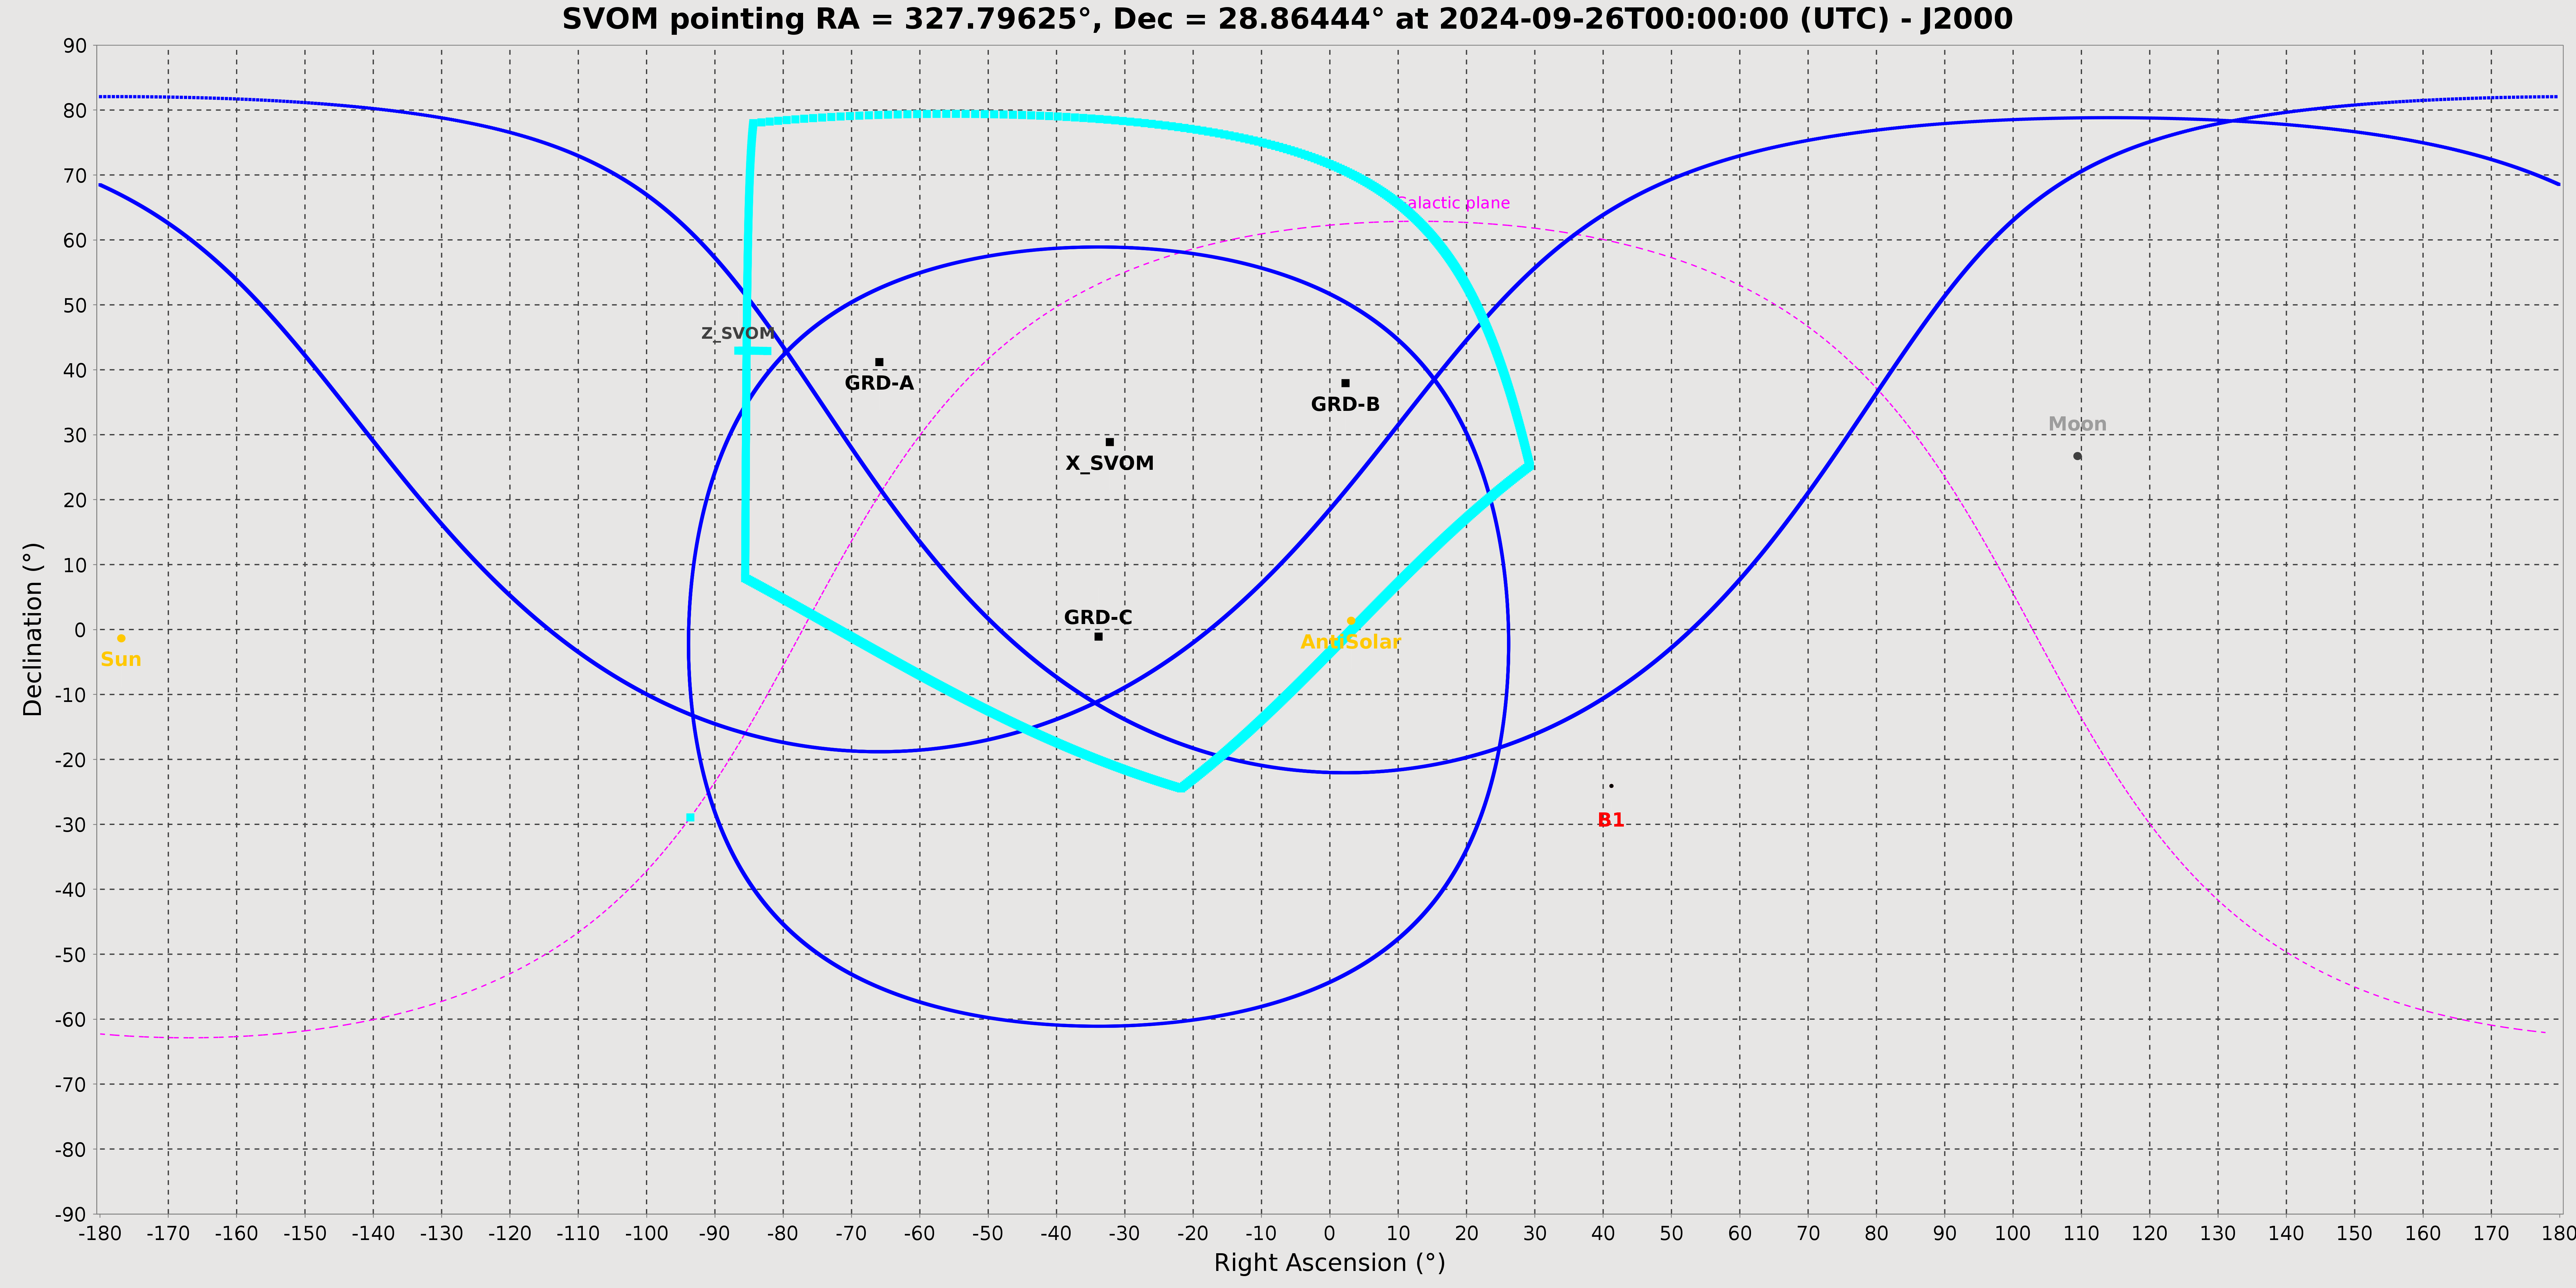
The other results are:
Angles for constraints assessment. For each constraint except the SAA, the value of the angle between the target direction and the limiting body (e.g. the Sun) is added for each sampled date in the downloadable text file containing detailed results for target observability.

The pointing quaternion. A dedicated box displays the quaternion associated to the pointing of the main target source chosen. It represents the rotation from the J2000 reference frame to the satellite frame. For the "period mode", the quaternion is computed at the start date of the time period selected.

The computed position, velocity and coordinates. When this option is chosen, a downloadable text file is created. It contains the computed values of position, velocity and coordinates of the satellite in the J2000 frame at each time step over the requested period.

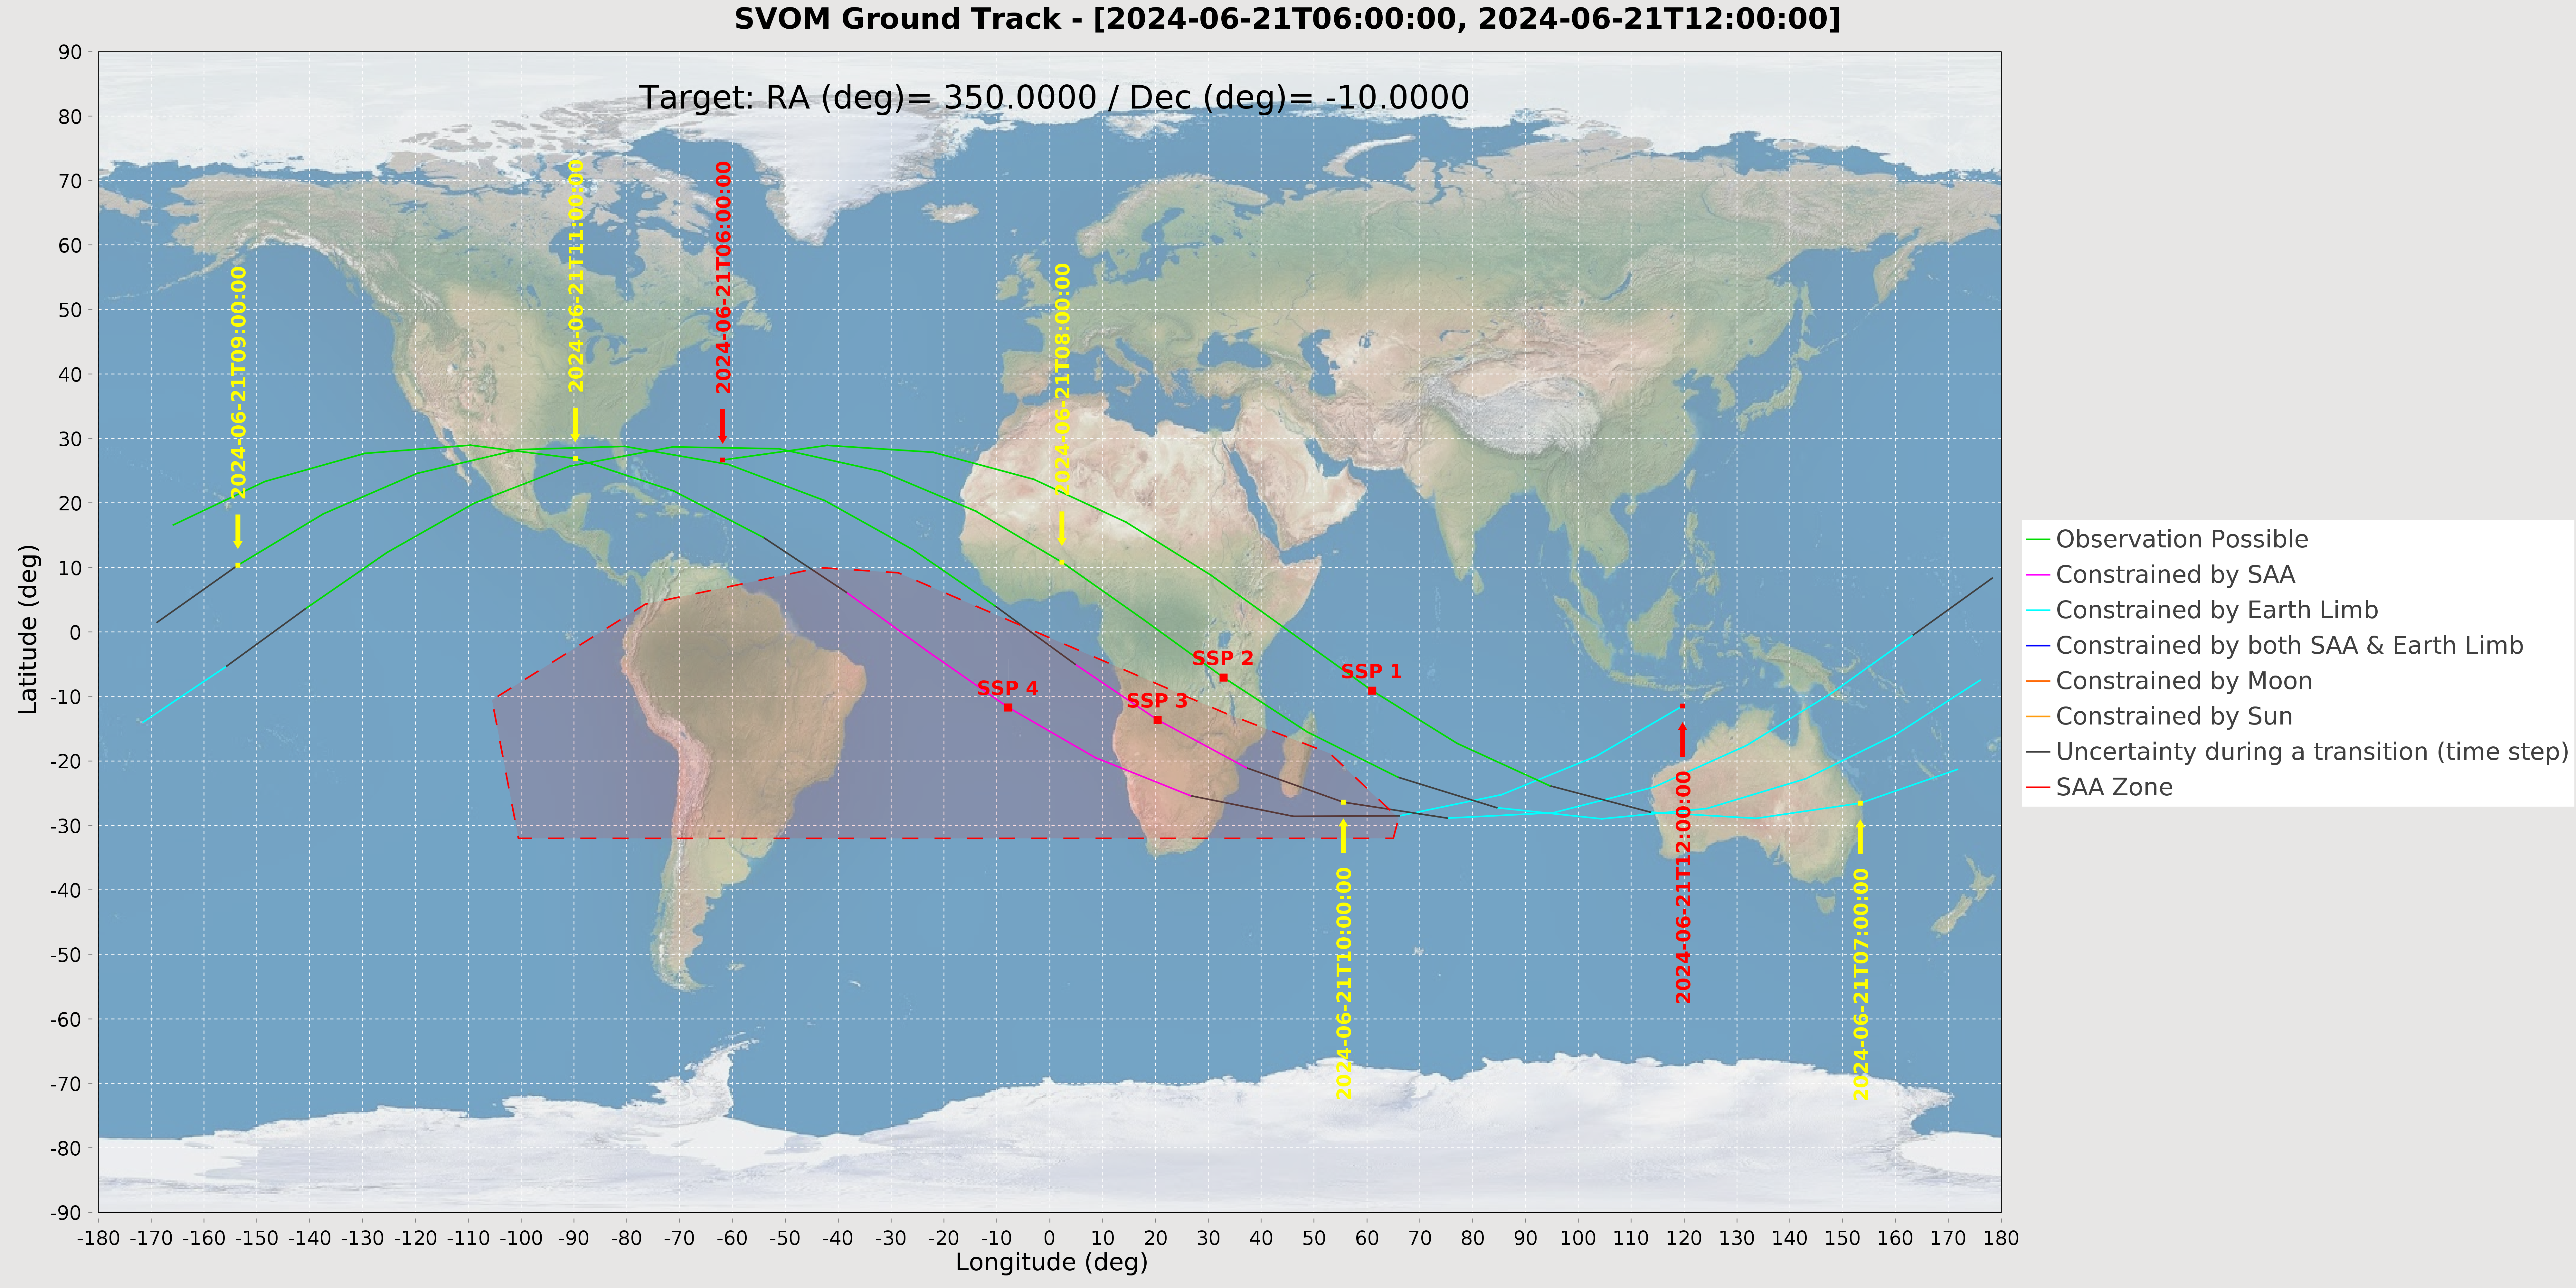
The ground track. The ground track corresponding to the period filled out is generated in a downloadable picture. The track line connects two points sampled with the chosen time step.
On this track, an indication of the time is associated to some points and the line is colored depending on which constraint is applying onto the satellite or instruments at the corresponding moment. The constraints are displayed following this priority order: Combination of SAA and Earth Limb > SAA or Earth Limb > Moon > Sun.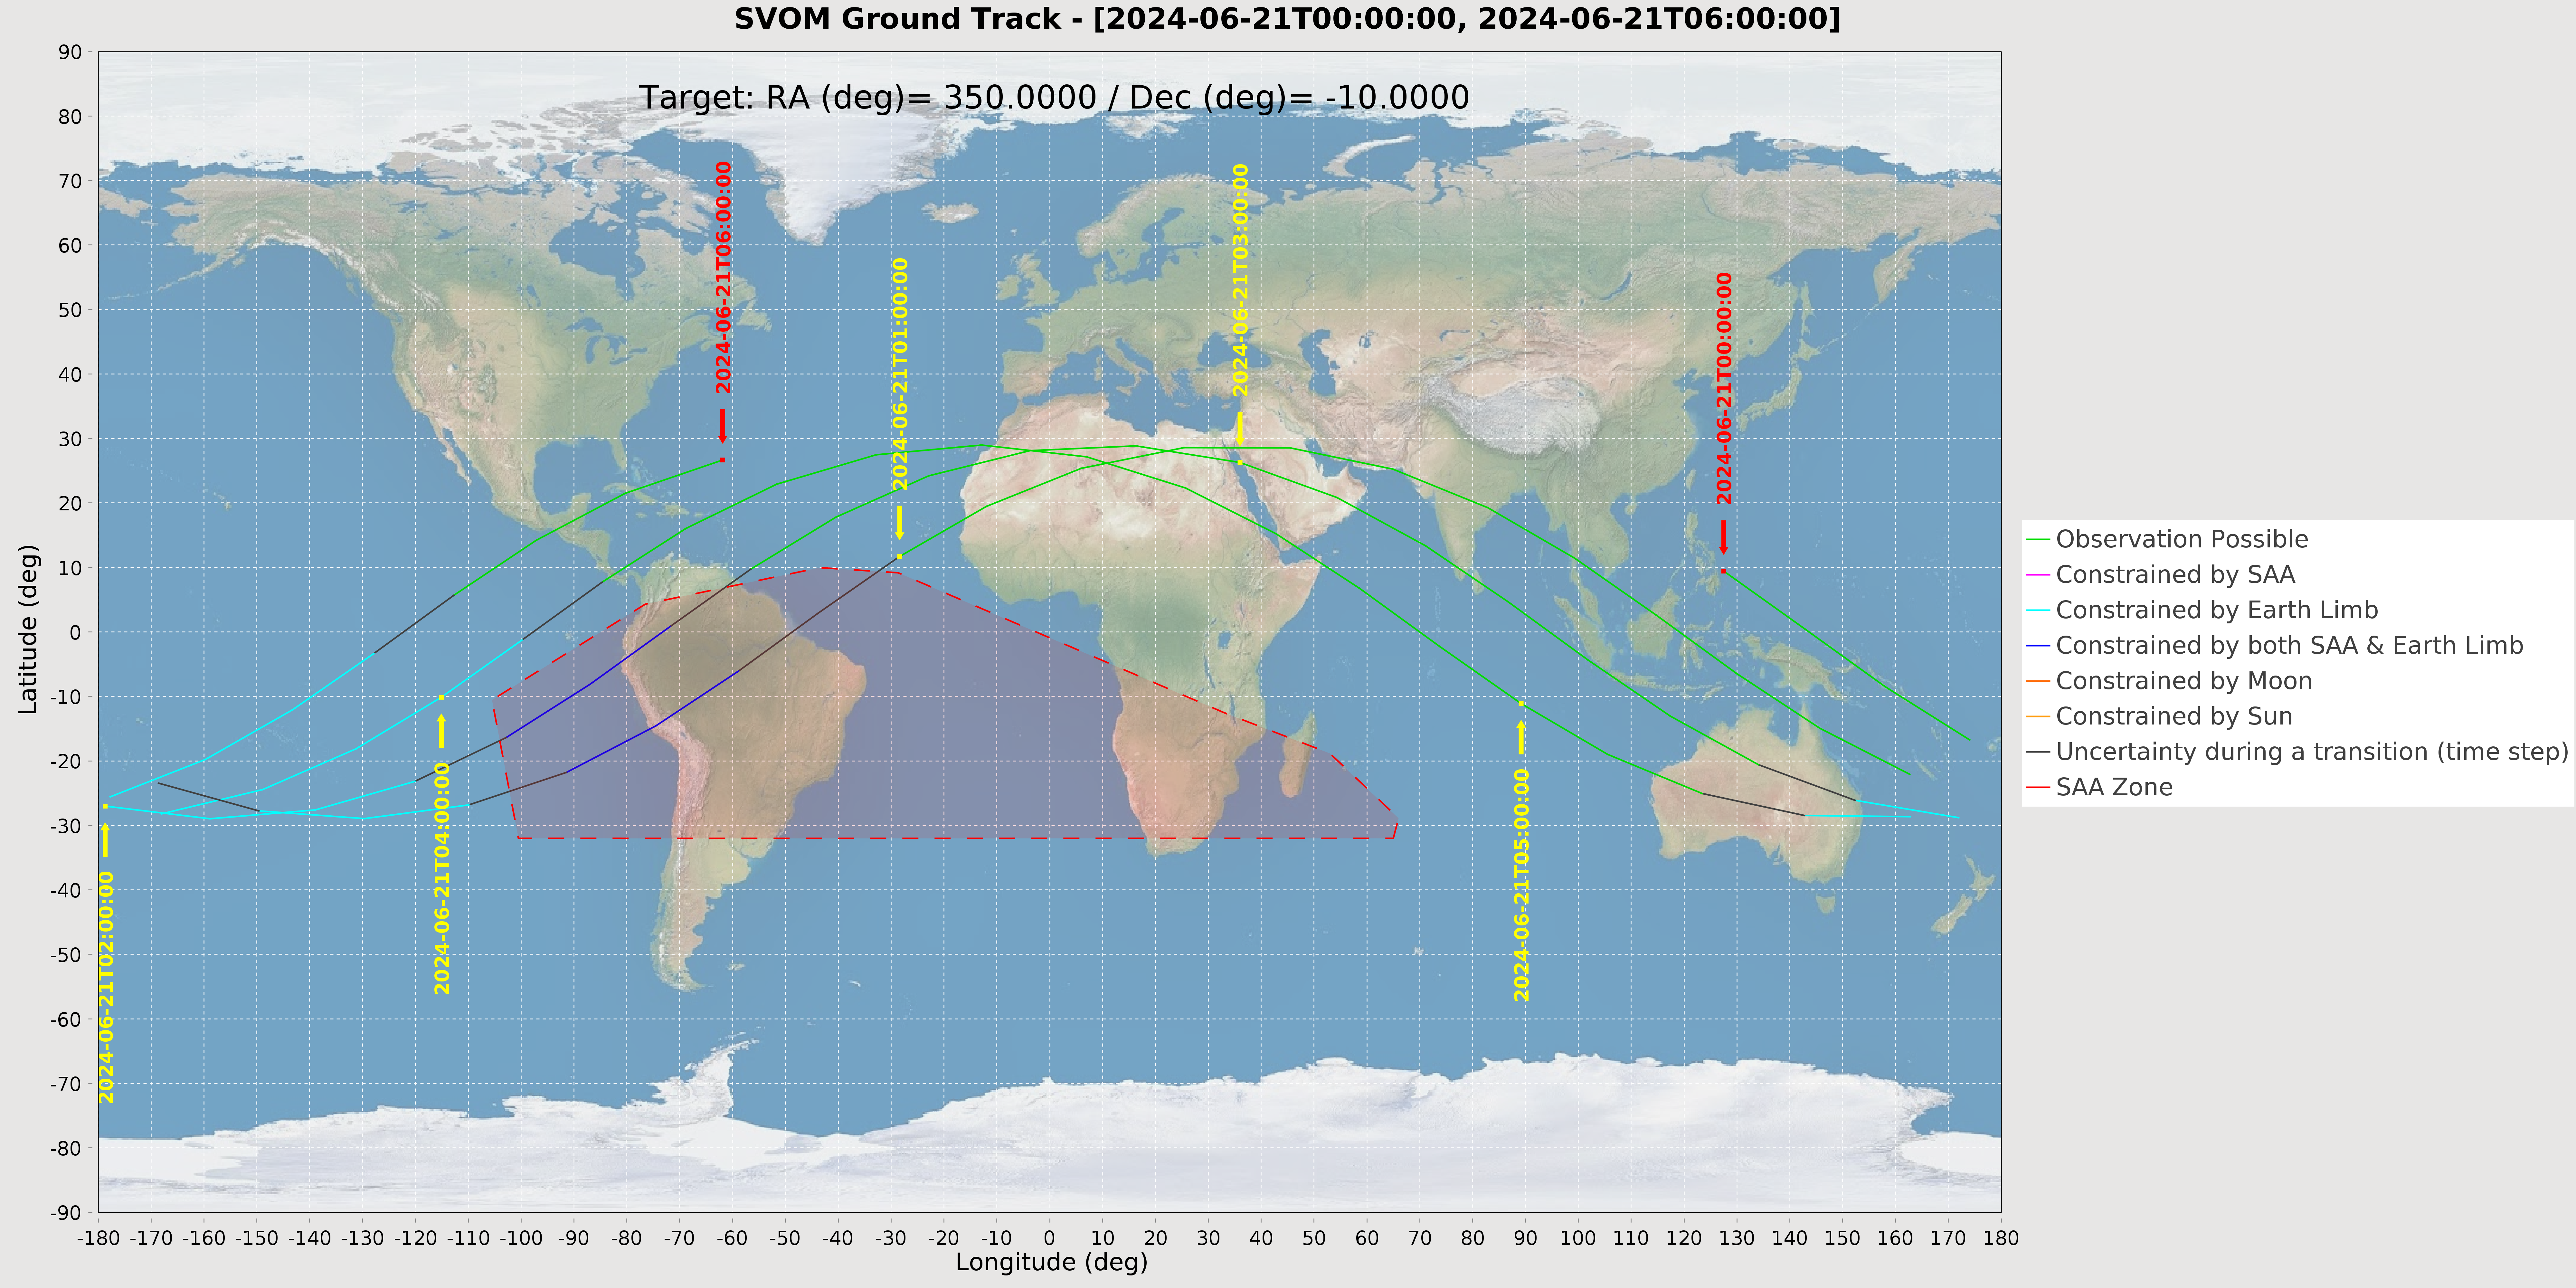
The subsolar points. If option activated, the subsolar points on every orbit are computed and their list is downloadable with a text file. Note that the times associated to these subsolar points are determined with an accuracy corresponding to the time step chosen. Note also that these points can differ from the General Slew Points (GSP) defined in the SVOM system since SSTOMP doesn't compute and so, doesn't consider the visibility intervals over X-band ground stations.

Using the Ground Track option and the subsolar points option at the same time will allow you to see them appear on the ground track representation.
If selected, a dedicated section gives similar results as for the main target source, but this time, for the targets pointed to by the different GRM instrument heads (GRDs) and resulting from the pointing of the X axis of SVOM towards the main target source selected. Note that another dedicated tool in SSTOMP allows for pointing, if feasible, any of the GRDs to a chosen sky target.
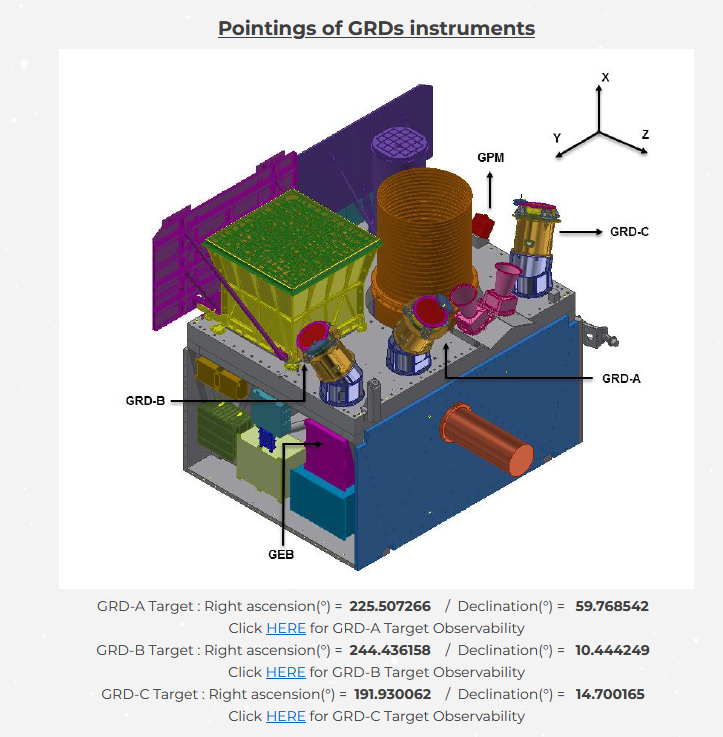
The observability of the GRDs. This part shows the flag status of each constraint (Sun, Moon, Earth limb, B1) assessed with respect to the direction pointed to by every GRD and sampled over the requested period. Note that the Sun constraint is also recalled for the X axis of the satellite and here, the SAA considered is the one defined for GRM.

The constraints angles. For each constraint except the SAA, the value of the angle between the GRD LOS direction and the limiting body (e.g. the Sun) is added in the downloadable text file of the target observability.

Additional targets. The same kind of results are provided for the optional additional targets and are displayed the same way. The dedicated boxes indicate if the additional target is in the FOV of each instrument or not and it also give the complementary coordinates associated (RA/Dec or Theta/Phi angles). As for GRDs, the user can download a text file detailing the observability associated to the pointing direction of those targets as well.
Observation with GRM
This tool is similar to the main functionality of SSTOMP, but it is specifically dedicated to assessment of observations of target sources assigned to one of the GRD of the GRM instrument. It has been designed to provide diverse information about the feasibility and features of a such an observation of a sky target source requested by the user and performed by a GRD. In particular, if feasible, the corresponding pointing (J2000 RA/Dec direction) to assign to the satellite is returned.
The inputs
The inputs of the form first consist of the three general boxes described in the General Information panel. As explained, the user has the option of switching between an "instant mode" (default choice) and a "period mode". The instant mode provides results at one chosen date defined only by the start date and time fields. On the contrary, the period mode provides information on a period of time delimited by the start and end dates fields, sampled according to the time step assigned. You can activate this mode by just clicking on the option in the target observation box. The content and presentation of the results computed and returned will be slightly different depending on the mode selected.

There is also another box in the form associated to the main tool: the Result Options. Indeed, to supplement
the basic essential results, you can choose to compute and get or not some additional results proposed by this function of the SSTOMP tool. The choices are relatively
straightforward and divided into two main parts, one for data and one for graphic representations and charts. Some choices will lead to display new boxes and forms to get
the related inputs needed from the user (see further).
Note : for data, the user has the option of being provided with results in a "raw format". This means that the results produced
in text files will not be formatted (with titles, tables and field names) in order to allow for an easier use with other applications if needed.
If the option “central longitude” is filled, maps produced are centered on this specific longitude. By default, central longitude is 0°.
The longitude indicated implicitly refers to the chosen frame, J2000 or galactic.
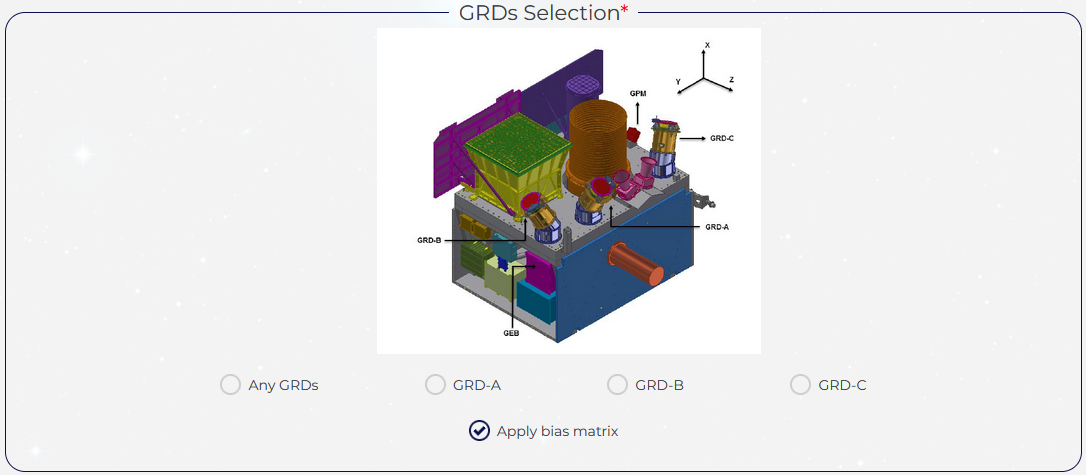
This form allows the user for choosing which GRD heads of the GRM instrument will be considered for the assessment of the observation of target source selected and which bias (orientation) matrix he wants to be applied to represent the LOS frames associated to each GRD (if no bias is selected, the GRD LOS frames are set according to the theoretical orientation of each GRD head).
Note that multiple choices are possible allowing for performing all computations for each GRD selected in one go.
If the option is chosen, a dedicated form has been implemented with the purpose to let the user select the list of sky sources to be displayed on sky charts. two modes are available : The default automatic mode proposes some default lists of sources related each to an instrument and that you can browse (click on the "HERE" button). The other mode which is the manual one allows you to download a template and then, to enter your own list of sources with the "Choose a file" button.

The results
The target observability. In the "instant mode", the box (one for each GRD selected) shows the flags corresponding to the status of each constraint (met/not met) computed at the requested date and time from the point of view of each GRD, but also always including the Sun constraint status for the satellite itself. Note that it has been chosen to consider here that the Sun constraint with respect to the direction pointed to by a GRD was evaluated using a specific guard angle and had to be considered to establish the global observability status of the target source at a given time.
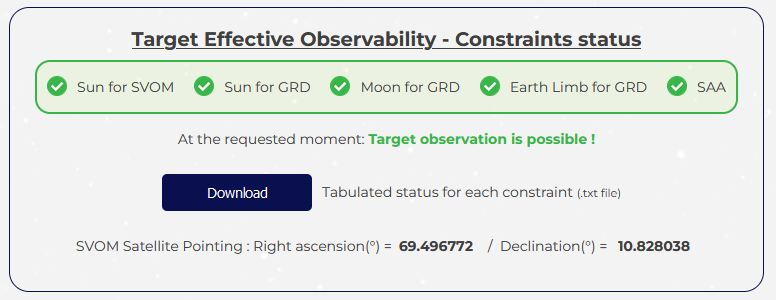
In the "period mode", the tool displays, for each GRD selected, a table listing the intervals when effective observation is possible (i.e. without any constraint) between the start and end dates of the chosen global period.

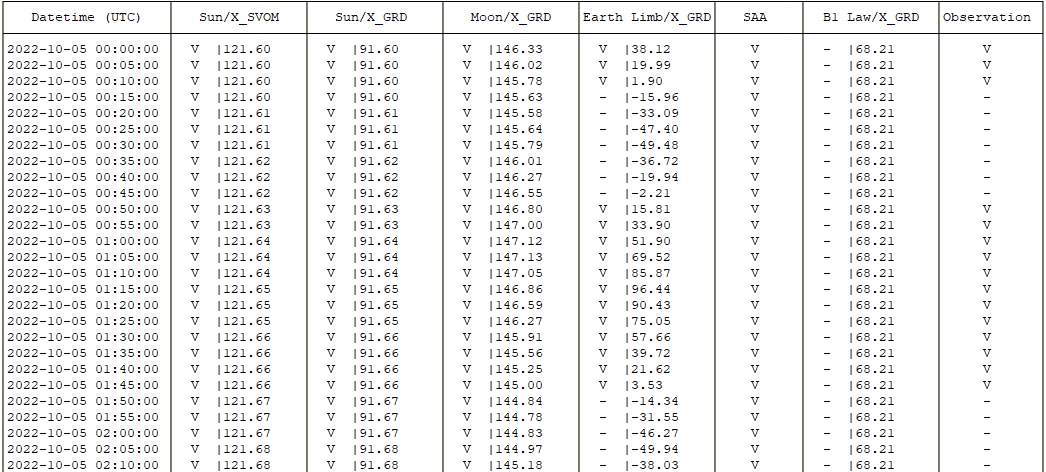
And in both cases, it proposes to download the results as a text file containing the status of each constraint at every sampled date and supplemented optionally with angular values associated. Depending on the user's choice, this text file can be formatted or not (raw results option activated). When it is feasible, this function returns the pointing of the SVOM satellite (RA/Dec coordinates in J2000) to have the selected GRD point towards the chosen sky target source. This information is displayed in the result box and recorded in the text file. Note that the Sun constraint is always evaluated for the SVOM satellite (X axis) and other constraints (Sun, Moon, Earth limb) also evaluated considering the LOS direction of the GRD. The SAA considered is also the one defined for GRM.
The additional results. This part includes several information such as the mean availability per orbit of the target estimated over the year (from a predefined table and only depending on the pointing direction). In the "period mode", based on the observability results for the GRD considered and the chosen target source, it shows the mean availability of the target computed over the period selected. If a wished effective observation duration was filled out, it also calculates the effective duration obtained over the period and the estimated minimum number of orbits that would be necessary to have the requested effective observation duration (from the mean availability measured over the period).
Note : as a reminder, the availability is defined as the ratio between the cumulative duration of all intervals when effective observation is possible and the total duration of the period.
The sky representation. This section will show you visually the chosen target source pointed to by the GRD considered and also, the source pointed to by the X axis of SVOM on a sky map in various coordinates systems (J2000, galactic) and projections (rectangular, Mollweide) depending on the different results options you choose. Other information can also be represented on this chart as galactic plane, orbit plane and poles, Sun and Moon positions, ECLAIRs FOV, GRD pointings and FOV, additional sky sources and targets, B1 pointing. The corresponding image can be downloaded. In the representation of the sky chart, J2000 Right ascensions or galactic longitudes are indicated from positive values on the left to negative values on the right in order to correspond to the natural observing view of the sky from Earth
Note: Some elements are represented either at the unique selected date or middle date of period or selected date for the quaternion depending on the options chosen. Moon position is sampled over the period.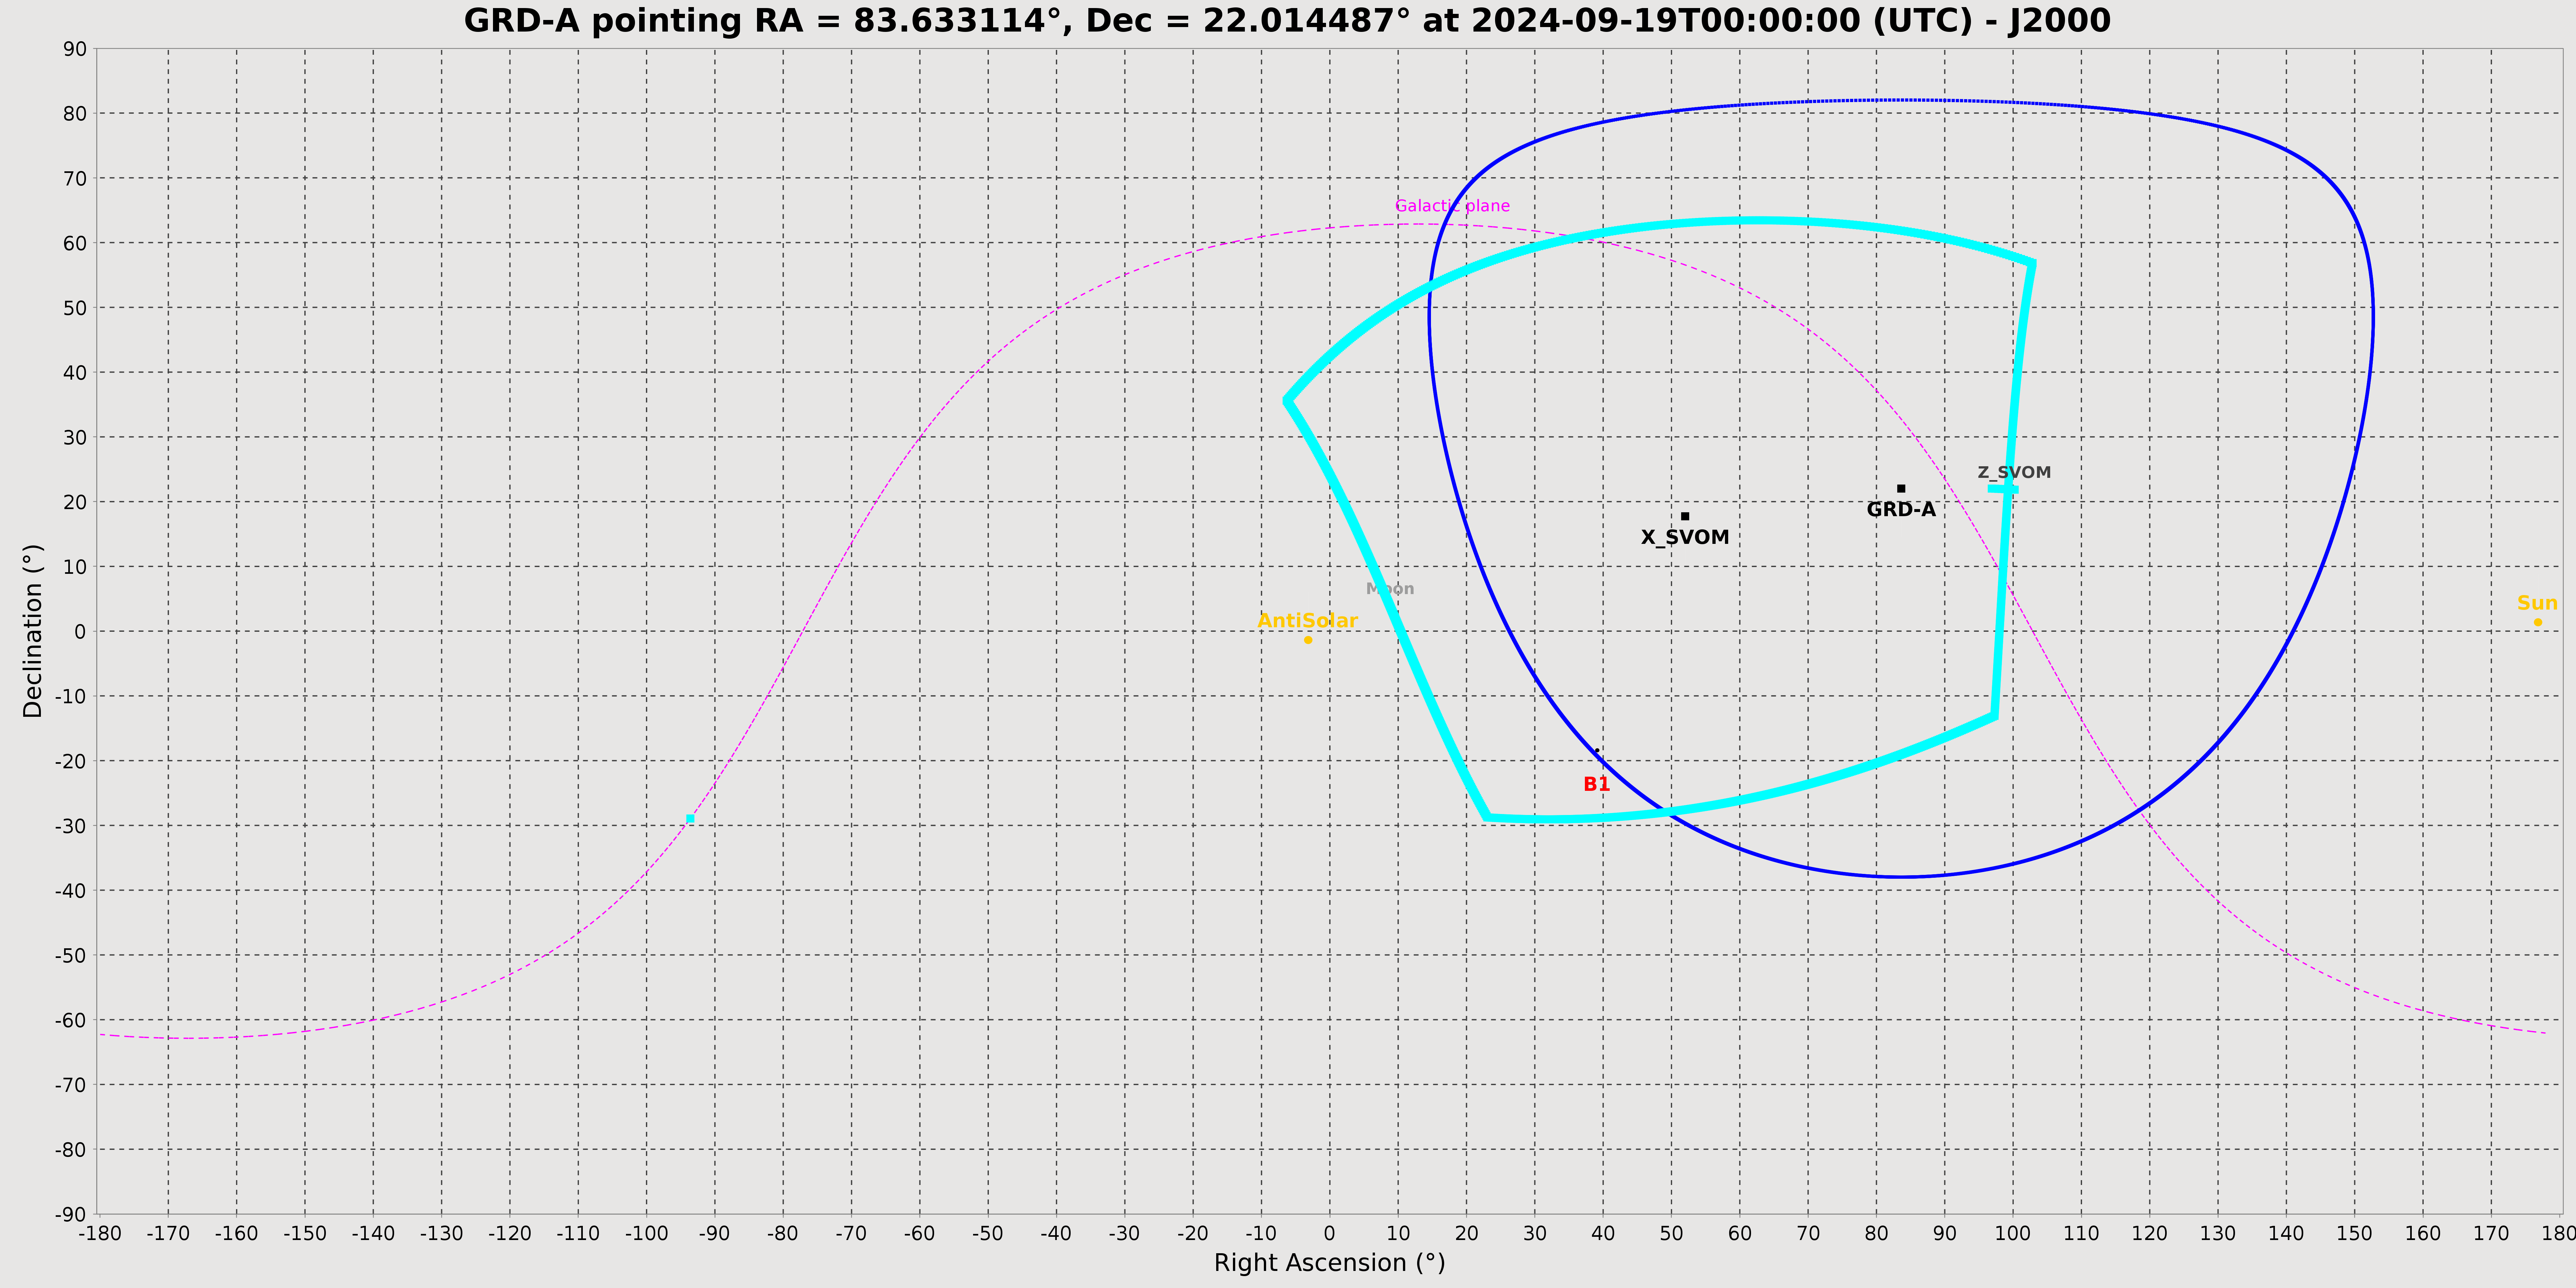
Observation associated to chosen Theta/Phi angles
This tool is similar to the main functionality of SSTOMP, but it is specifically dedicated to assessment of an observation of a target source having given Theta/Phi angles in the satellite frame and chosen by the user. It has been designed to provide diverse information about the feasibility and features of a such an observation. In particular, if feasible, the corresponding pointing (J2000 RA/Dec direction) to assign to the satellite is returned.
The inputs
The inputs of the form first consist of the three general boxes described in the General Information panel. As explained, the user has the option of switching between an "instant mode" (default choice) and a "period mode". The instant mode provides results at one chosen date defined only by the start date and time fields. On the contrary, the period mode provides information on a period of time delimited by the start and end dates fields, sampled according to the time step assigned. You can activate this mode by just clicking on the option in the target observation box. The content and presentation of the results computed and returned will be slightly different depending on the mode selected.

There is also another box in the form associated to the main tool: the Result Options. Indeed, to supplement
the basic essential results, you can choose to compute and get or not some additional results proposed by this function of the SSTOMP tool. The choices are relatively
straightforward and divided into two main parts, one for data and one for graphic representations and charts. Some choices will lead to display new boxes and forms to get
the related inputs needed from the user (see further).
Note : for data, the user has the option of being provided with results in a "raw format". This means that the results produced
in text files will not be formatted (with titles, tables and field names) in order to allow for an easier use with other applications if needed.
If the option “central longitude” is filled, maps produced are centered on this specific longitude. By default, central longitude is 0°.
The longitude indicated implicitly refers to the chosen frame, J2000 or galactic.
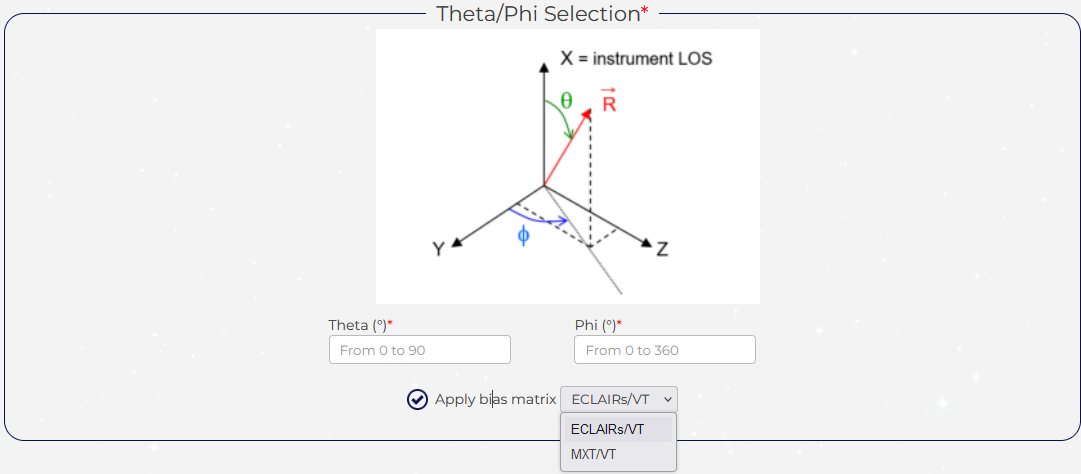
This form allows the user for choosing the Theta/Phi angles he wants to be associated to the observing direction of the selected sky target source and optionally selecting the bias matrix he wants to be applied to represent the LOS frames to be associated to the Theta/Phi angles. Two predefined bias matrices are proposed (VT/ECLAIRs or VT/MXT). The definition of these matrices is given in the SSTOMP general parameters file. Note that the choice of the matrix is independent of the initial choice of the instrument for definition of associated constraints to be checked.
Note : the Theta/Phi angles are those defined for the SVOM system and they allow for defining a direction in the satellite frame, supposed here to be equal to the Line of Sight (LOS) frame of each one of the three instruments ECLAIRs, MXT, VT unless a specific bias matrix is chosen.
If the "Representation of GRDs FOV" option has been chosen, dedicated form has been implemented with the purpose to let the user apply GRM bias matrices.

If the option is chosen, a dedicated form has been implemented with the purpose to let the user select the list of sky sources to be displayed on sky charts. two modes are available : The default automatic mode proposes some default lists of sources related each to an instrument and that you can browse (click on the "HERE" button). The other mode which is the manual one allows you to download a template and then, to enter your own list of sources with the "Choose a file" button.

The results
The target observability. In the "instant mode", the box shows the flags corresponding to the status of each constraint (met/not met) computed at the requested date and time from the point of view of the Theta/Phi direction, but also always including the Sun constraint status for the satellite itself. Note that it has been chosen to consider here that the status of the Sun constraint with respect to the direction define by Theta/Phi angles was just indicative (flagged "NA" for not applicable) and not to be considered to establish the global observability status of the target source at a given time.
The tool also returns information to recall the set of worst case constraints applied and the status of the pointing direction with respect to the FOV of each instrument.
In the "period mode", the tool displays a table listing the intervals when effective observation is possible (i.e. without any constraint) between the start and end dates of the chosen global period.

And in both cases, it proposes to download the results as a text file containing the status of each constraint at every sampled date and supplemented optionally with angular values associated. Depending on the user's choice, this text file can be formatted or not (raw results option activated). When it is feasible, this function returns the pointing of the SVOM satellite (RA/Dec coordinates in J2000) to have the chosen sky target source pointed to with the chosen Theta/Phi angles. This information is displayed in the result box and recorded in the text file. Note that the Sun constraint is always evaluated for the SVOM satellite (X axis) and other constraints (Sun, Moon, Earth limb) also evaluated considering the direction of the target source (defined by the Theta/Phi angles). As for the basic tool, the values for the constraints checking and the SAA considered are the worst case values among the instruments selected.

The additional results. This part includes several information such as the mean availability per orbit of the target estimated over the year (from a predefined table and only depending on the pointing direction). In the "period mode", based on the observability results for the direction (defined by Theta/Phi angles) considered and the chosen target source, it shows the mean availability of the target computed over the period selected. If a wished effective observation duration was filled out, it also calculates the effective duration obtained over the period and the estimated minimum number of orbits that would be necessary to have the requested effective observation duration (from the mean availability measured over the period).
Note : as a reminder, the availability is defined as the ratio between the cumulative duration of all intervals when effective observation is possible and the total duration of the period.
The sky representation. This section will show you visually the chosen target source pointed to by the direction defined by the Theta/Phi angles and also, the source pointed to by the X axis of SVOM on a sky map in various coordinates systems (J2000, galactic) and projections (rectangular, Mollweide) depending on the different results options you choose. Other information can also be represented on this chart as galactic plane, orbit plane and poles, Sun and Moon positions, ECLAIRs FOV, GRD pointings and FOV, additional sky sources and targets, B1 pointing. The corresponding image can be downloaded. In the representation of the sky chart, J2000 Right ascensions or galactic longitudes are indicated from positive values on the left to negative values on the right in order to correspond to the natural observing view of the sky from Earth
Note: Some elements are represented either at the unique selected date or middle date of period or selected date for the quaternion depending on the options chosen. Moon position is sampled over the period.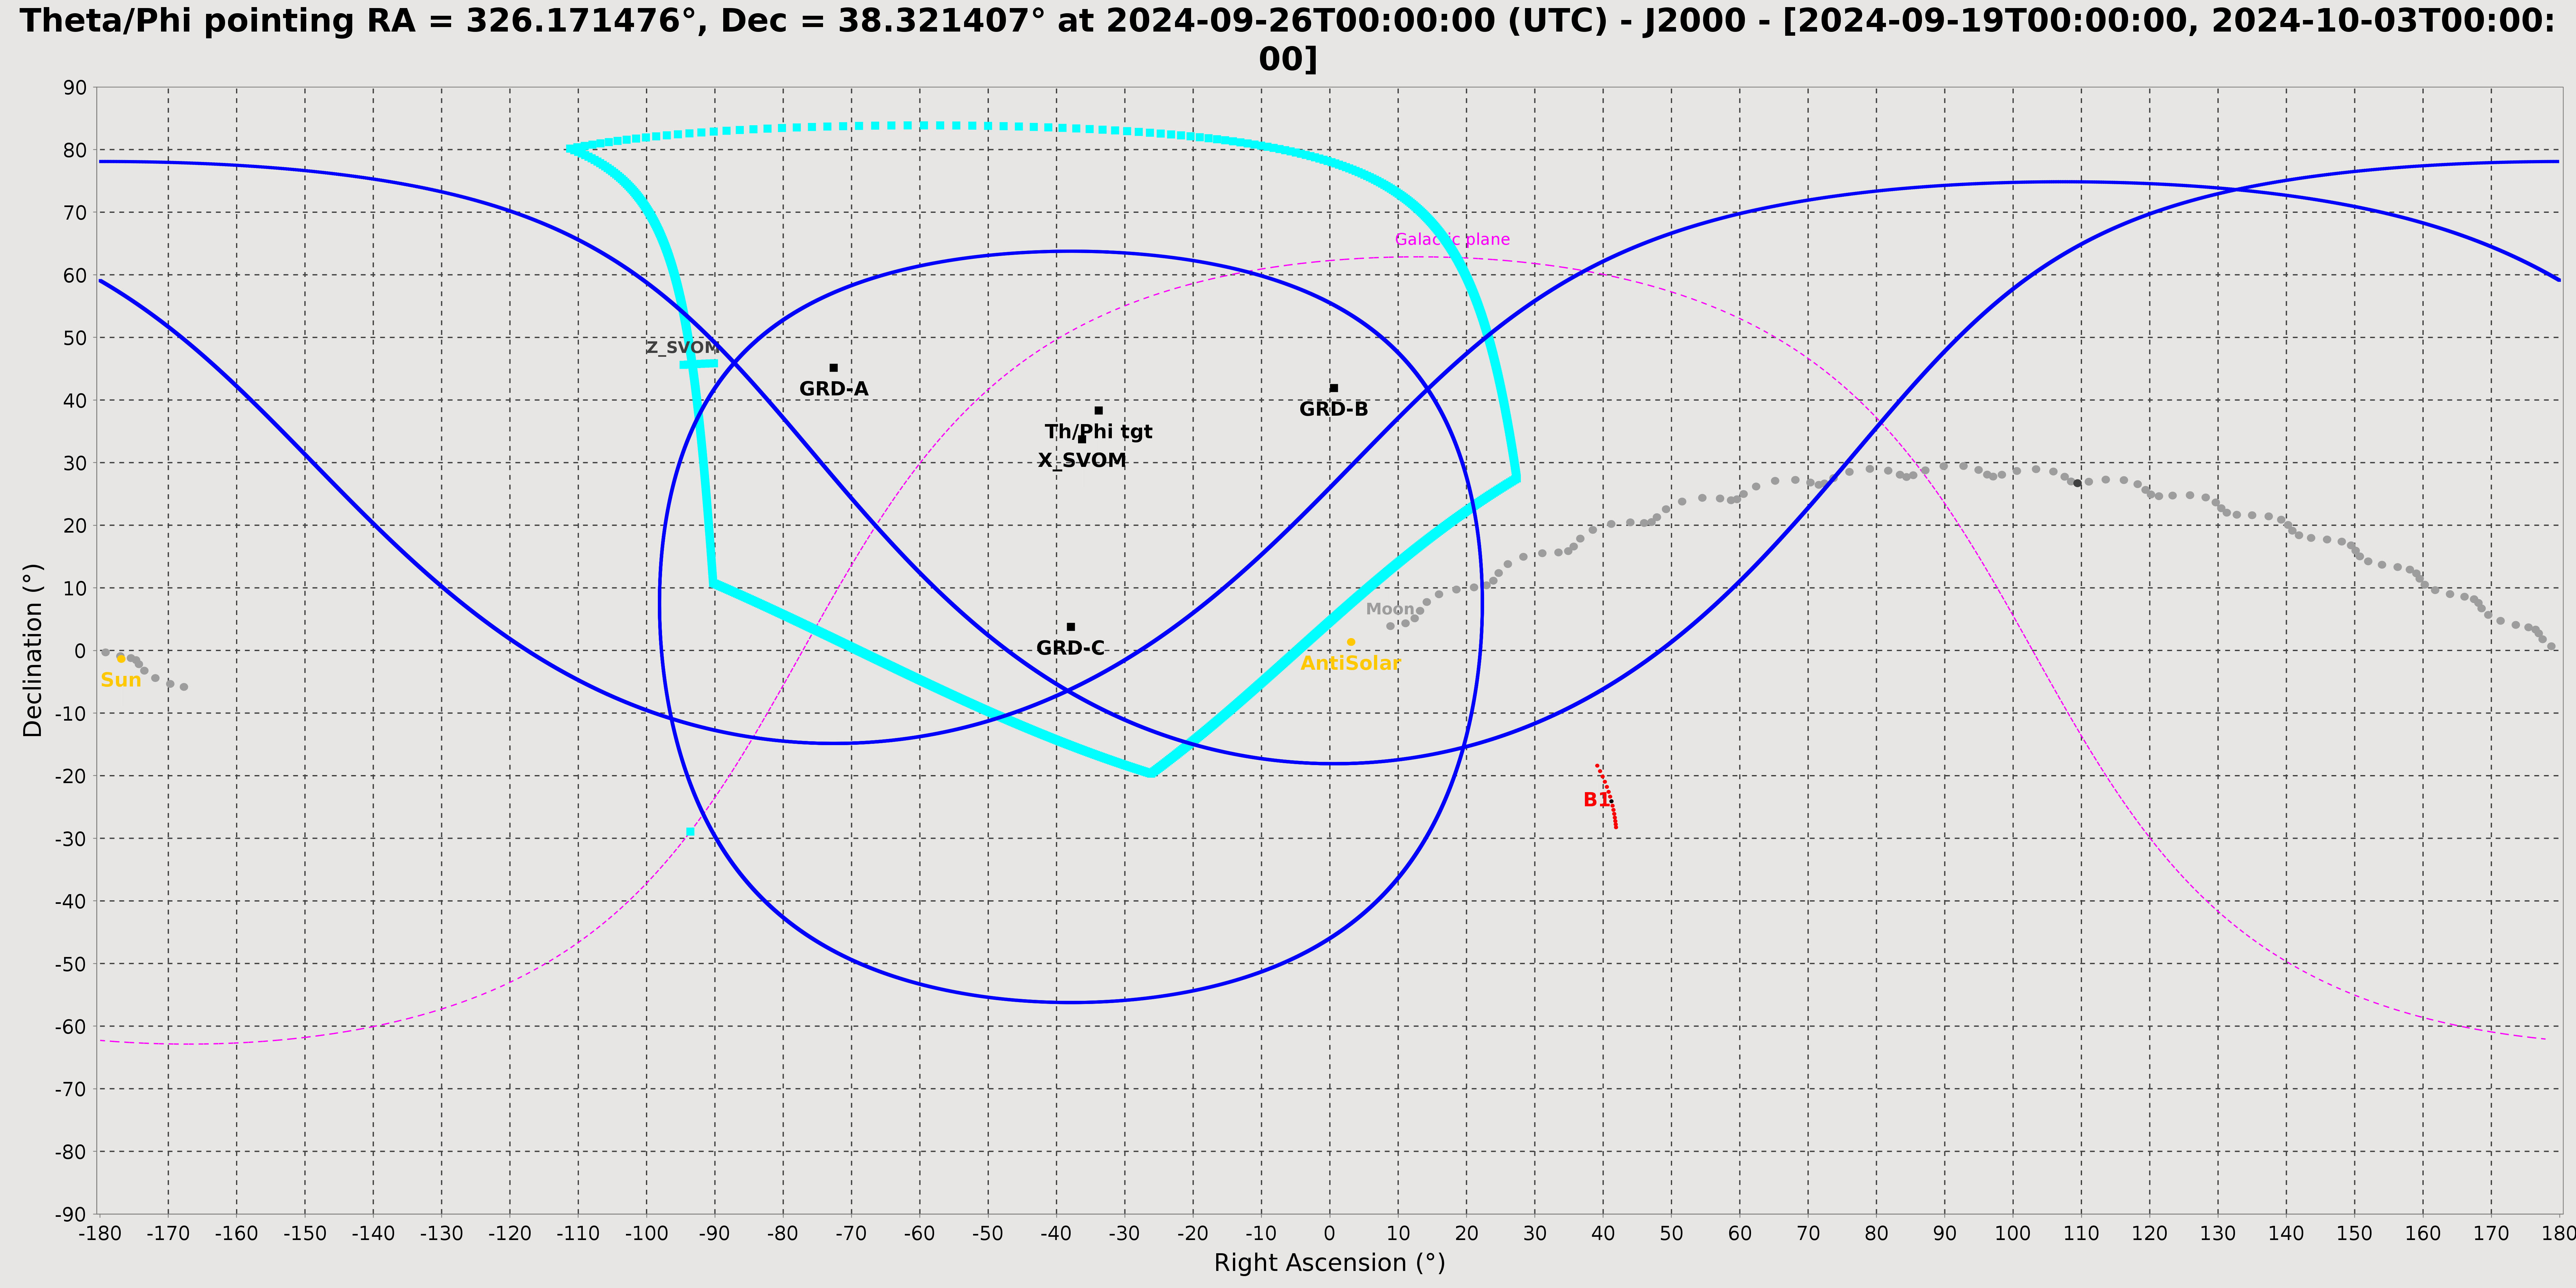
Compatibility with B1 law
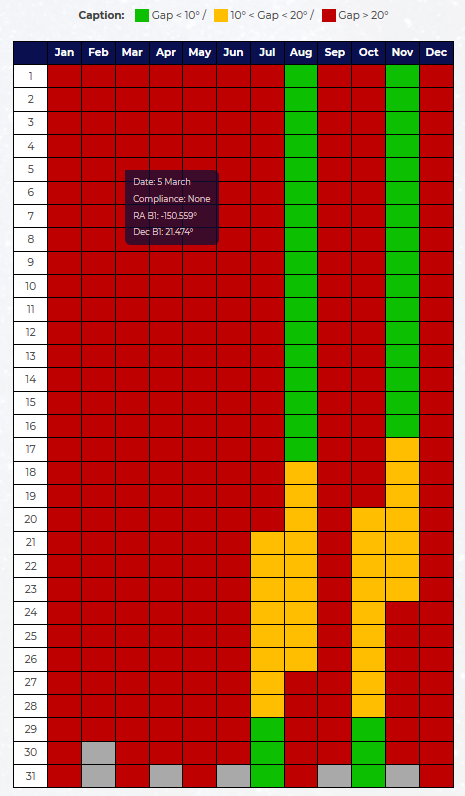
This tool provides complementary information regarding the compatibility of a target source with the B1 law over the whole year. The B1 pointing law is established in advance and consists in a predefined pointing given for each day of a generic calendar year and applicable exactly as it is for any particular year. It aims at optimizing the capability of GRB detection by ECLAIRs instrument. It is illustrated here with an animation for the year 2022 with an ECLAIRs field of view of 89°. You can also have the J2000 RA/Dec coordinates of the B1 pointing for each calendar day by moving the mouse cursor on the cells in the table below. During the SVOM mission, a large part of the observations of the General Program have to be located within 10.0° from the B1 pointing at a given date. So, with this tool, the user can check if and when a given source can be pointed to while being close to the B1 reference pointing of the day.
The inputs
The input form of this tool only consists in fulfilling the target direction defined by its right ascension and declination angles in the J2000 reference frame. Futhermore, you can select a target observation among predefined targets corresponding to known sources.

The results
The result produced is indicated in the initial table representing all the days of the year. For each day, it shows the compliance
of the target with the predefined B1 law by assignating a color to various levels according to angular distance between target and B1 pointings.
As said above, placing the mouse cursor over a cell will give more information such as the J2000 right ascension and declination angles of the B1 law for that day.
Combined Obs with Ground Telescope
This tool allows you to obtain and compare the periods of valid observability of a sky target by the satellite (as with the main basic tool of SSTOMP) and by a ground telescope (taken from a predefined list or defined by the user) over a time period. Then, it also computes the combined intervals when both facilities can observe simultaneously the selected target.
The inputs
The inputs of the form still first consist of the three general boxes described in the General Information panel in order to choose the sky target source, the time
period, the effective observation duration required and the instruments for constraints application. One additional specific box is also presented :
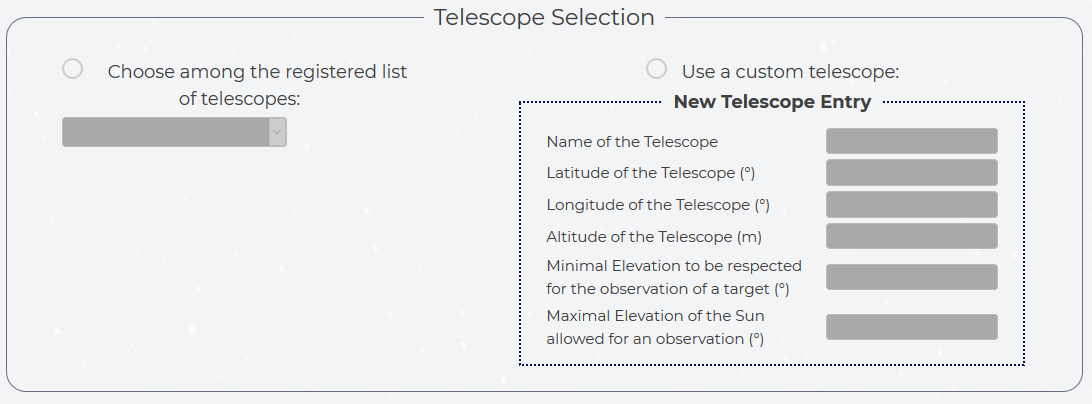
the telescope selection box.
This box allows for defining the ground telescope to be used in the computation. It offers you two options:
- You can select a telescope among the ones predefined in the application (those being part of the SVOM system supplemented by some that are commonly used).
- You can alternatively define a new ground telescope, if not in the predefined list, by providing directly all its characteristics necessary for the computation.
The Result Options box : Here, the only option relates to the presentation of data with the possible choice to get them in a "raw format". This means that the results produced in text files will not be formatted (with titles, tables and field names) in order to allow for an easier use with other applications if needed.

The results
Firstly, as for other tools, the section shows a recap of the worst case constraints applied among those of instruments selected. For each constraint, it indicates the limiting instrument taken into account.

Secondly, it displays the periods of observability in three tables corresponding to three different cases: from the SVOM satellite point of view only, from the ground telescope point of view only and from the combination of both the satellite and the telescope point of view. Below each table, it indicates also the total effective observing time available and compares it to the duration required by the user to determine if this latter is achievable.
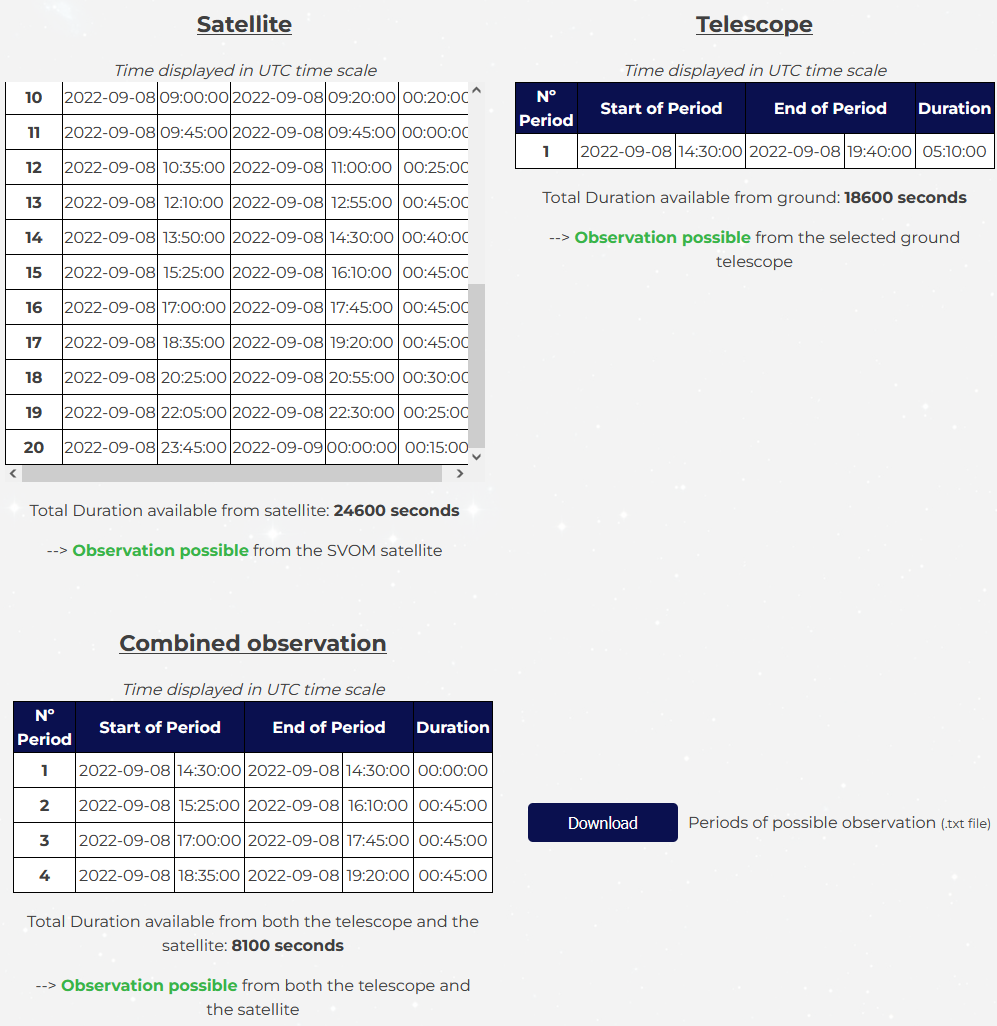
A summary of those tables can be downloaded in a text file.

Combined Obs with other satellite
This tool allows you to obtain and compare the periods of valid observability of a chosen sky target by SVOM (as with the SSTOMP main basic tool) and by another satellite (selected from a predefined list) over a time period. Then, it also computes the combined intervals when both facilities can observe simultaneously the selected target.
The inputs
This tool allows you to obtain and compare the periods of valid observability of a chosen sky target by SVOM (as with the SSTOMP main basic tool) and by another satellite (selected from a predefined list) over a time period.
Then, it also computes the combined intervals when both facilities can observe simultaneously the selected target.
This box allows for defining the other satellite to be used in the computation. It requires several choices :
- You have to select a satellite among the ones predefined in the application.
- You can also define which related specific constraints will be taken into account and checked to assess the visibility of a given sky source.
Only applicable and consistent constraints for the selected satellite are displayed.
The parameters for these constraints are also tunable in the general Mission Parameters file.
- For JWST satellite : The JWST orbite at the L2 point is not precisely modelized (supposed to be at exact L2 point). Two min/max angles define the accessible FOV and an exclusion angle constraint is added with respect to the velocity direction of satellite around Sun.
- For INTEGRAL satellite : a specific constraint is added regarding the minimum altitude allowing for observation.

The Result Options box : Here, the only option relates to the presentation of data with the possible choice to get them in a "raw format". This means that the results produced in text files will not be formatted (with titles, tables and field names) in order to allow for an easier use with other applications if needed.

The results
Firstly, as for other tools, this section shows a recap of the worst case constraints applied for both SVOM and other satellite selected. For each constraint, it indicates the limiting values.
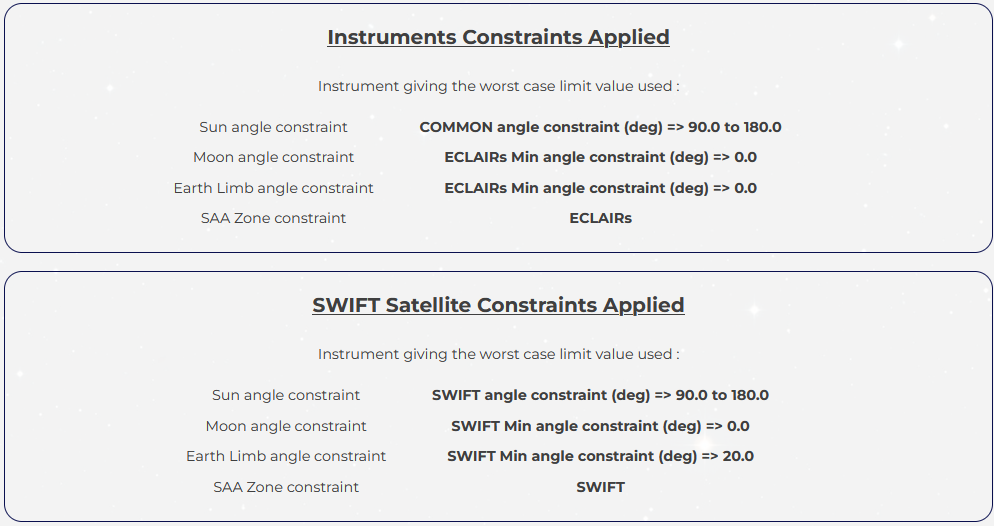
Secondly, it displays the periods of observability presented with three tables corresponding to following features: from the SVOM satellite point of view only, from the other satellite point of view only and from the combination of both satellites point of view. Below each table, it indicates also the total effective observing time available and compares it to the duration required by the user to determine if this latter is achievable.
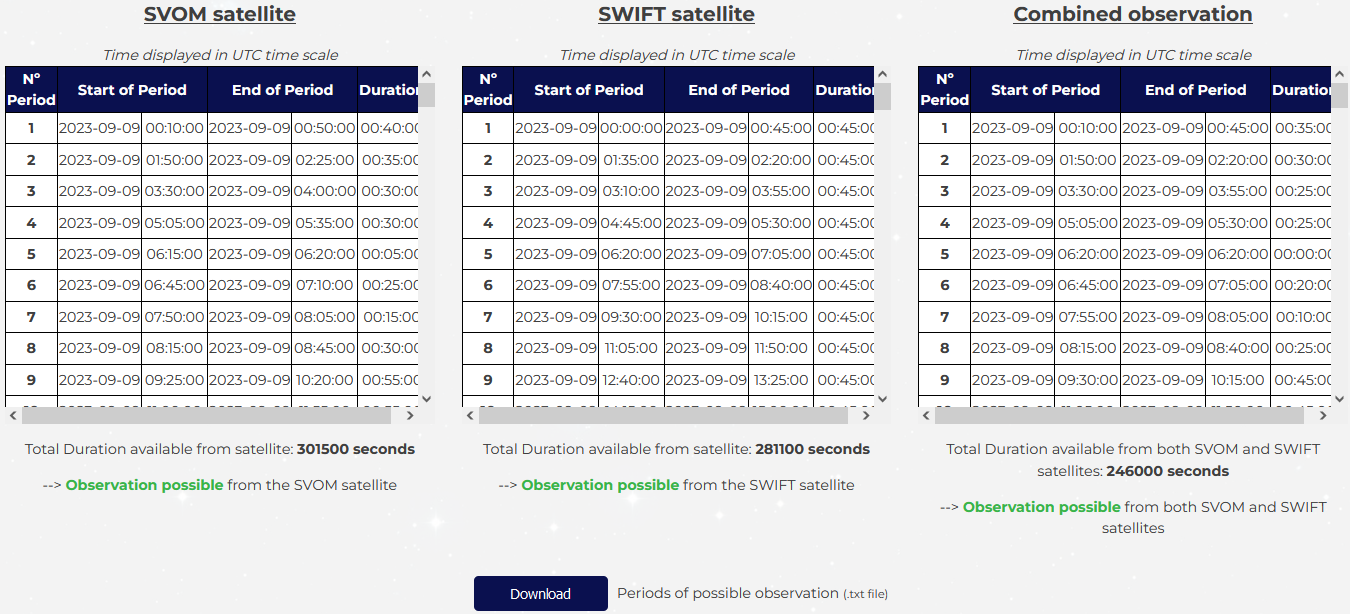
A summary of those tables can be downloaded in a text file.
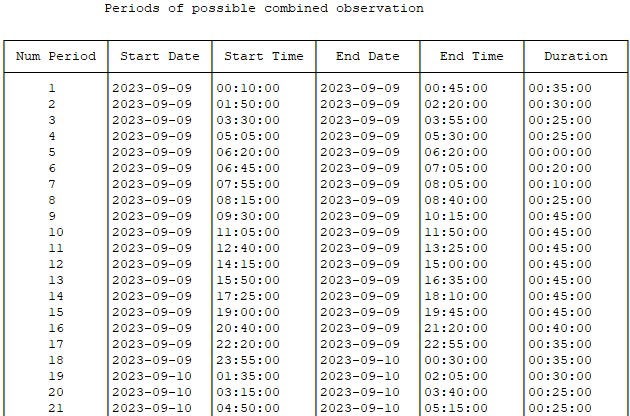
Chart of full sky accessibility
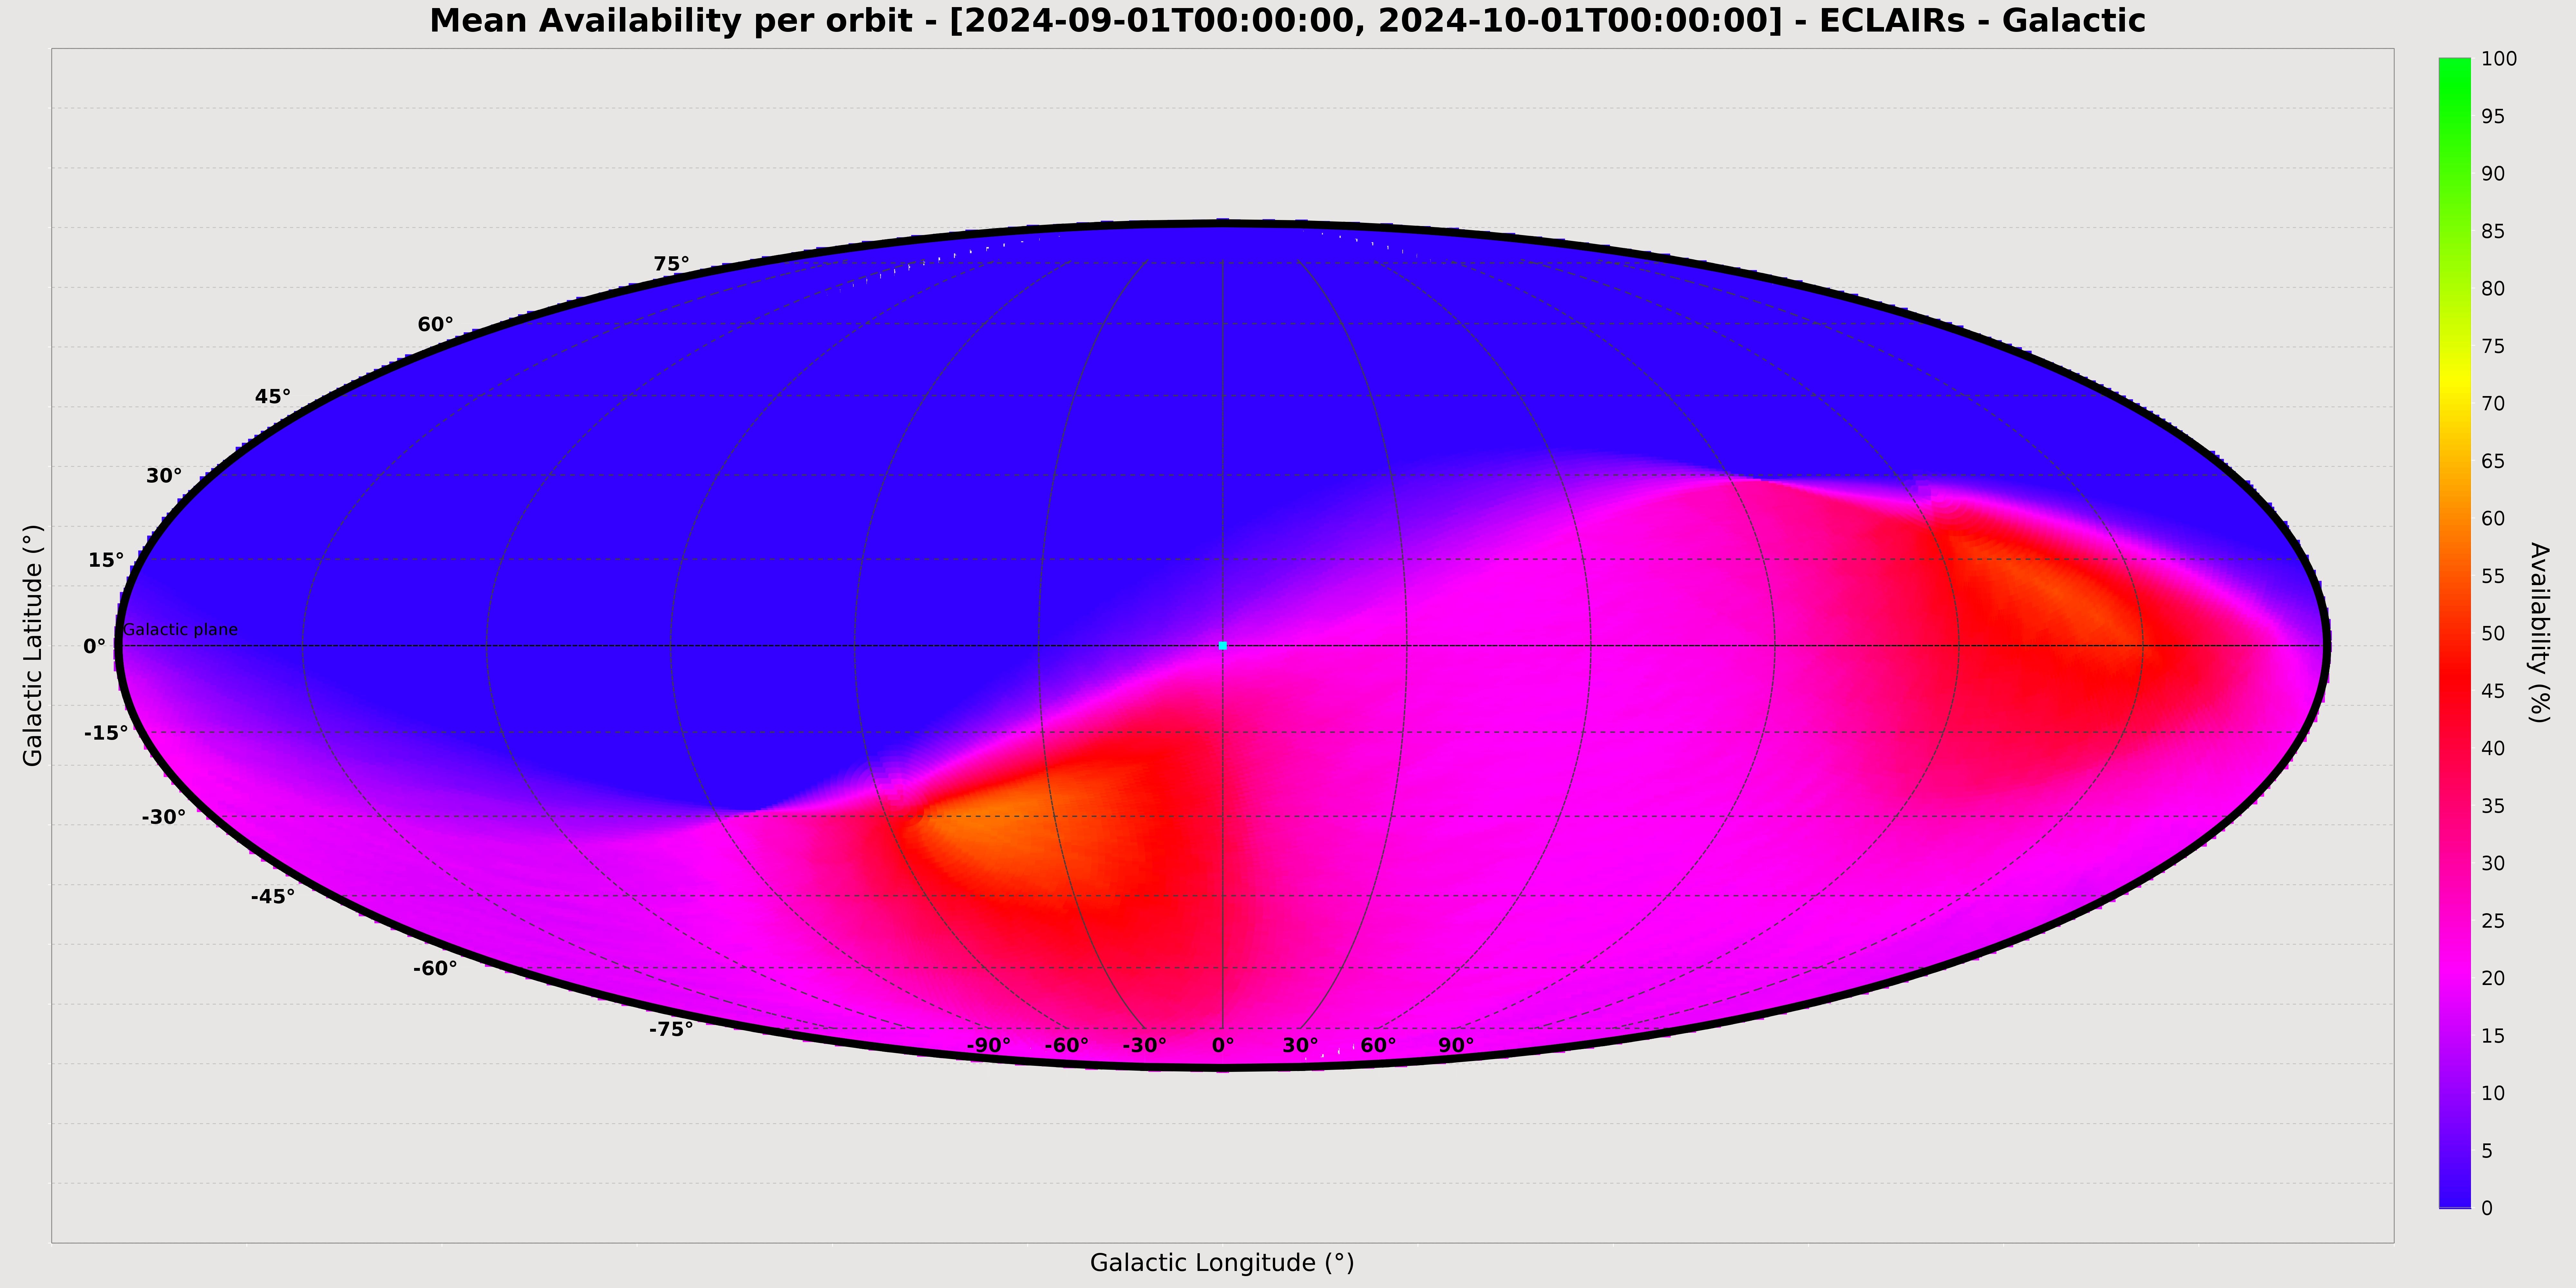
This tool allows you to compute some charts representing the mean availability (= accessibility) of each direction in the sky (sampling with 1° x 1° meshes) over a given period.
Note : as a reminder, the availability is defined as the ratio between the cumulative duration of all intervals when effective observation is possible (i.e. useful time without any constraint) and the total duration of the period.
The constraints considered are first the Sun constraint (imposed globally by the whole satellite and preventing from observing a given direction usually during long periods in the year) and secondly, the Moon constraint (periodic disturbance
during a few days), the Earth occultations and SAA crossings (disturbance during some parts of orbits). For Moon, Earth and SAA constraints, the limit values depend on the choice of instruments among (VT, MXT, ECLAIRs).
The charts produced are colored depending on the ratio of accessibility over the period considered.
The inputs
The user can choose the operating mode he wants :
- The user can select “availability computation” to run the process establishing the observing availability from all chosen inputs.
- The user can alternatively just choose an external file to display with the same graphic chart representation. For that, it is then possible to download a template for a compatible availability file respecting the expected format, with the "Choose a file" button in the "Availability File Selection" input box.

When the user chooses 'availability computation' option, the input form uses again the general input boxes described in the General Information panel for orbit definition, instruments selection and a simplified version for the observation box with only fields related to the definition of the time period and time step having to be filled in. As for other tools, the choice of the instruments to consider will drive the assignment of worst case values of constraints to apply for the availability assessment.

When the user selects 'external file display' option, the input form proposes an input box to select the external file to display.

The Result Options box : Some straightforward options are still also proposed for the results to be produced, mainly for sky representations (coordinates, projections, additional sources, relative scale).
See other tools pages for more detail.
If the option “central longitude” is filled, maps produced are centered on this specific longitude. By default, central longitude is 0°.
The longitude indicated implicitly refers to the chosen frame, J2000 or galactic.

If the option is chosen, a dedicated form has been implemented with the purpose to let the user select the list of sky sources to be displayed on sky charts. two modes are available : The default automatic mode proposes some default lists of sources related each to an instrument and that you can browse (click on the "HERE" button). The other mode which is the manual one allows you to download a template and then, to enter your own list of sources with the "Choose a file" button.

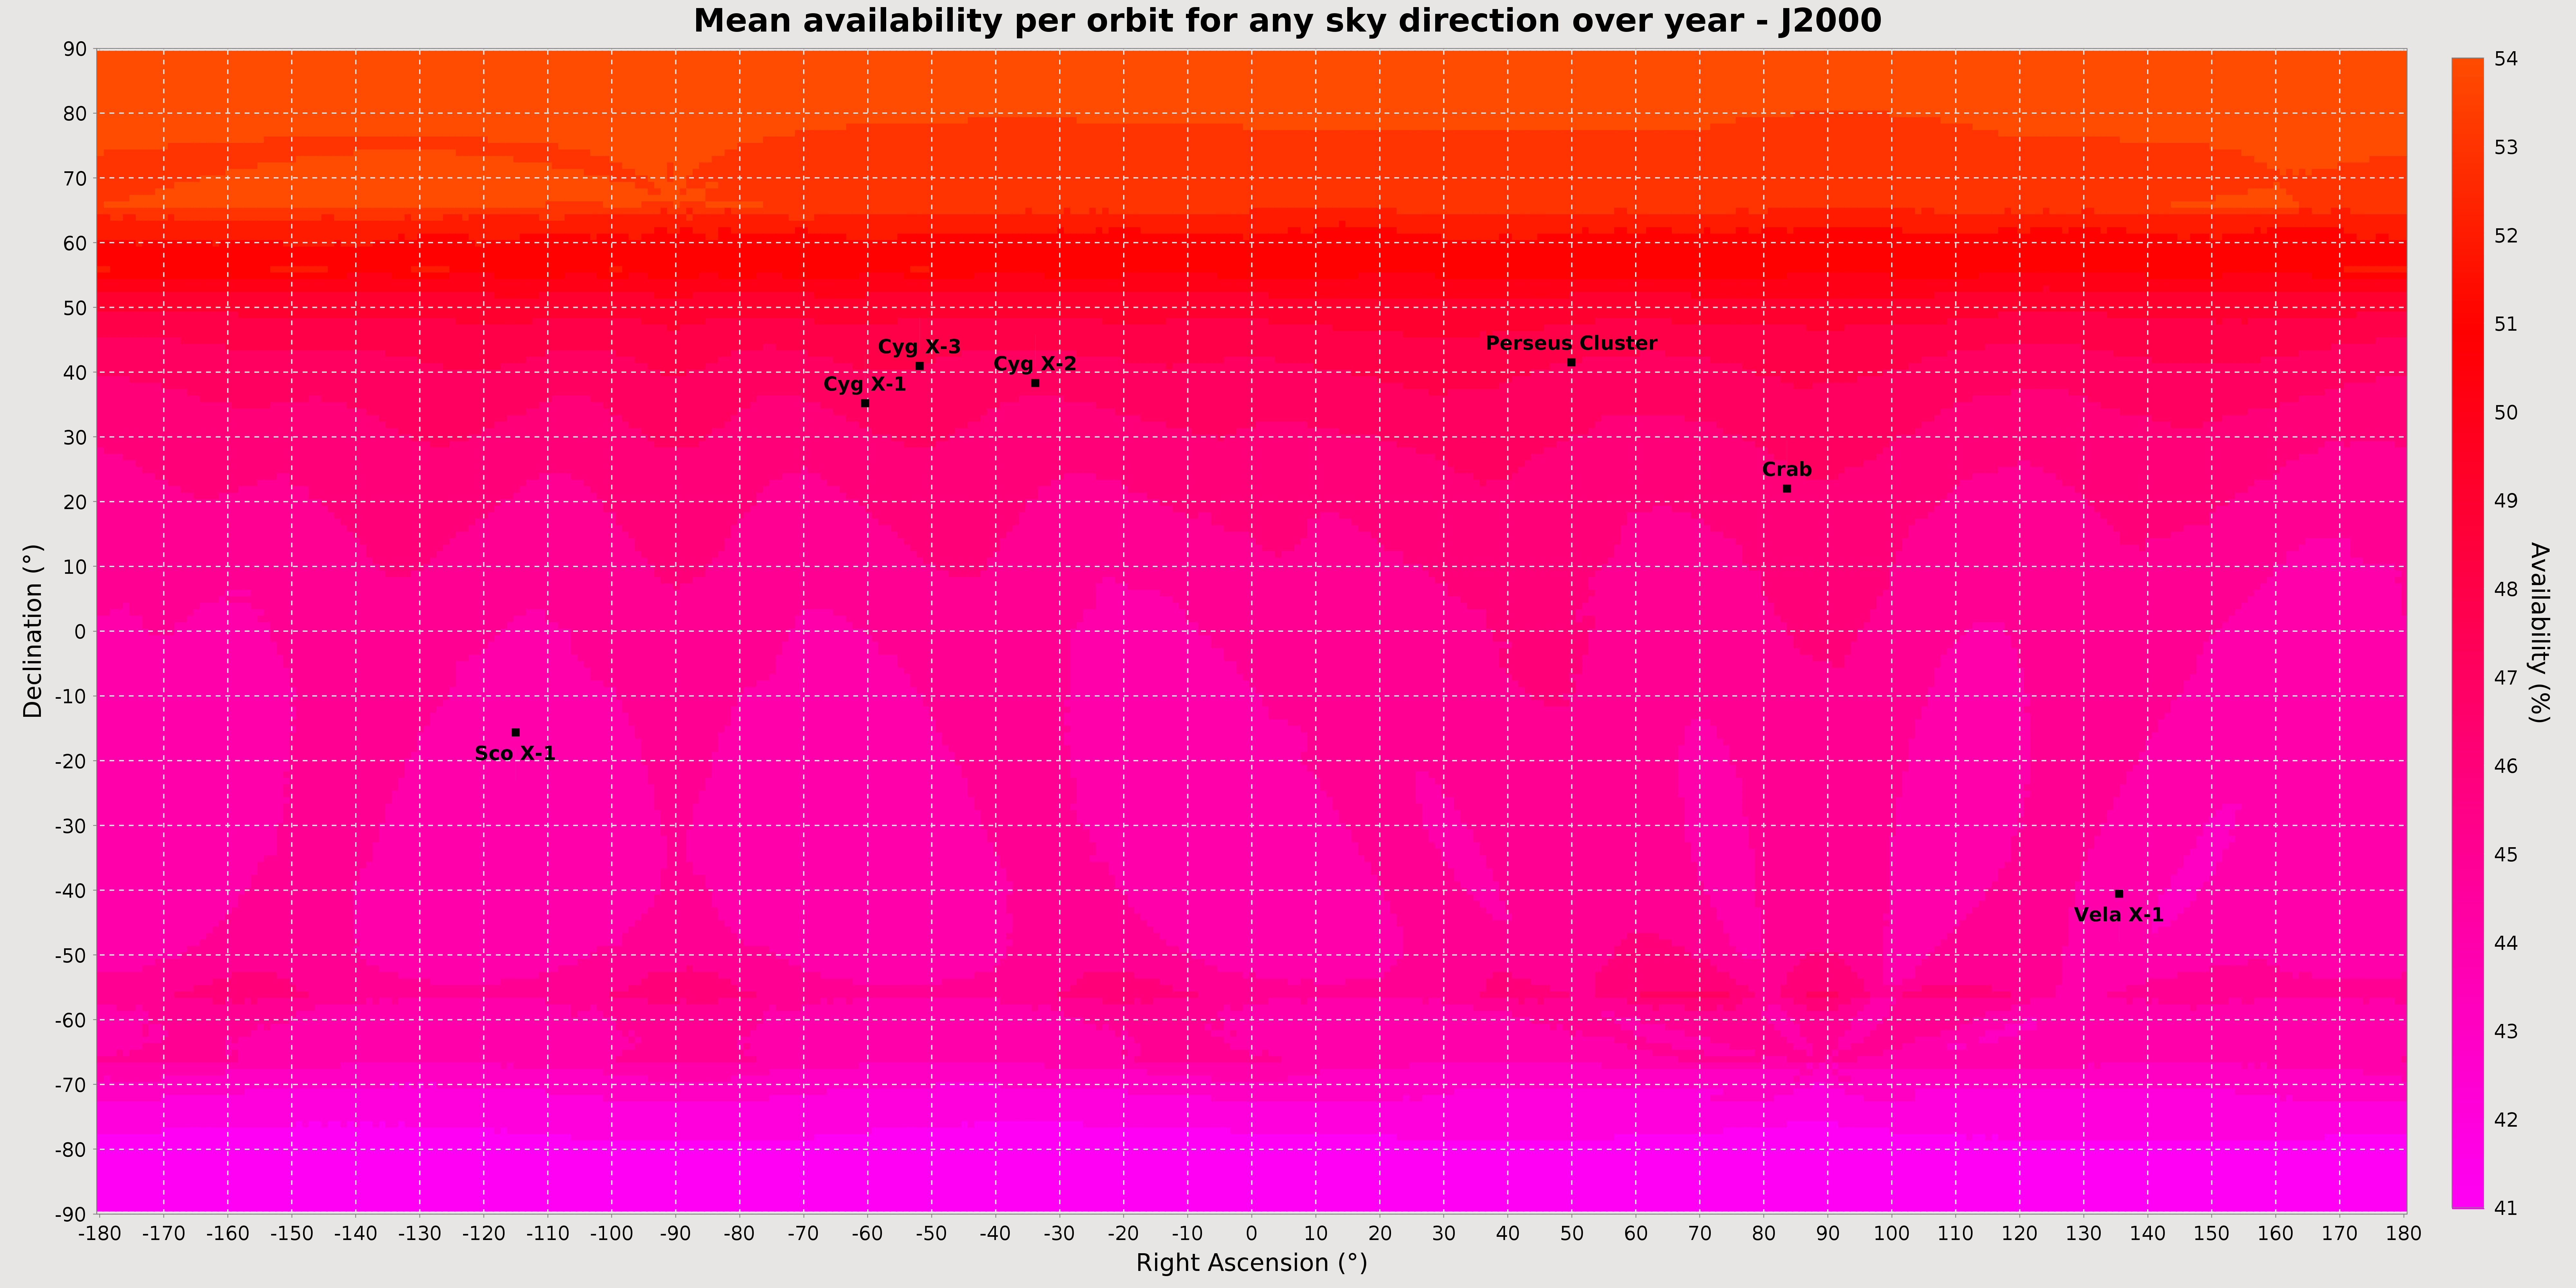
The input section also displays systematically the precomputed mean availability chart of every sky direction sampled and established over a whole year.
Of course, in this case, the periods in the year when the Sun constraint is not met are not considered for any given direction. Some important particular sky sources
are also represented by default. The color scale is indicated as a function of the availability ratio in percentage.
This chart is displayed before any computation and is downloadable.
Note : when the computation is triggered, a pop-up box gives a rough estimate of the running time (depending on the duration of the period and of the time step)
so that the user can be informed and confirm it or choose to change his choices if this running time is too long.
The results
Firstly, as for other tools, the section shows a summary of the worst case constraints applied among those of instruments selected. For each constraint, it indicates the limiting instrument taken into account.

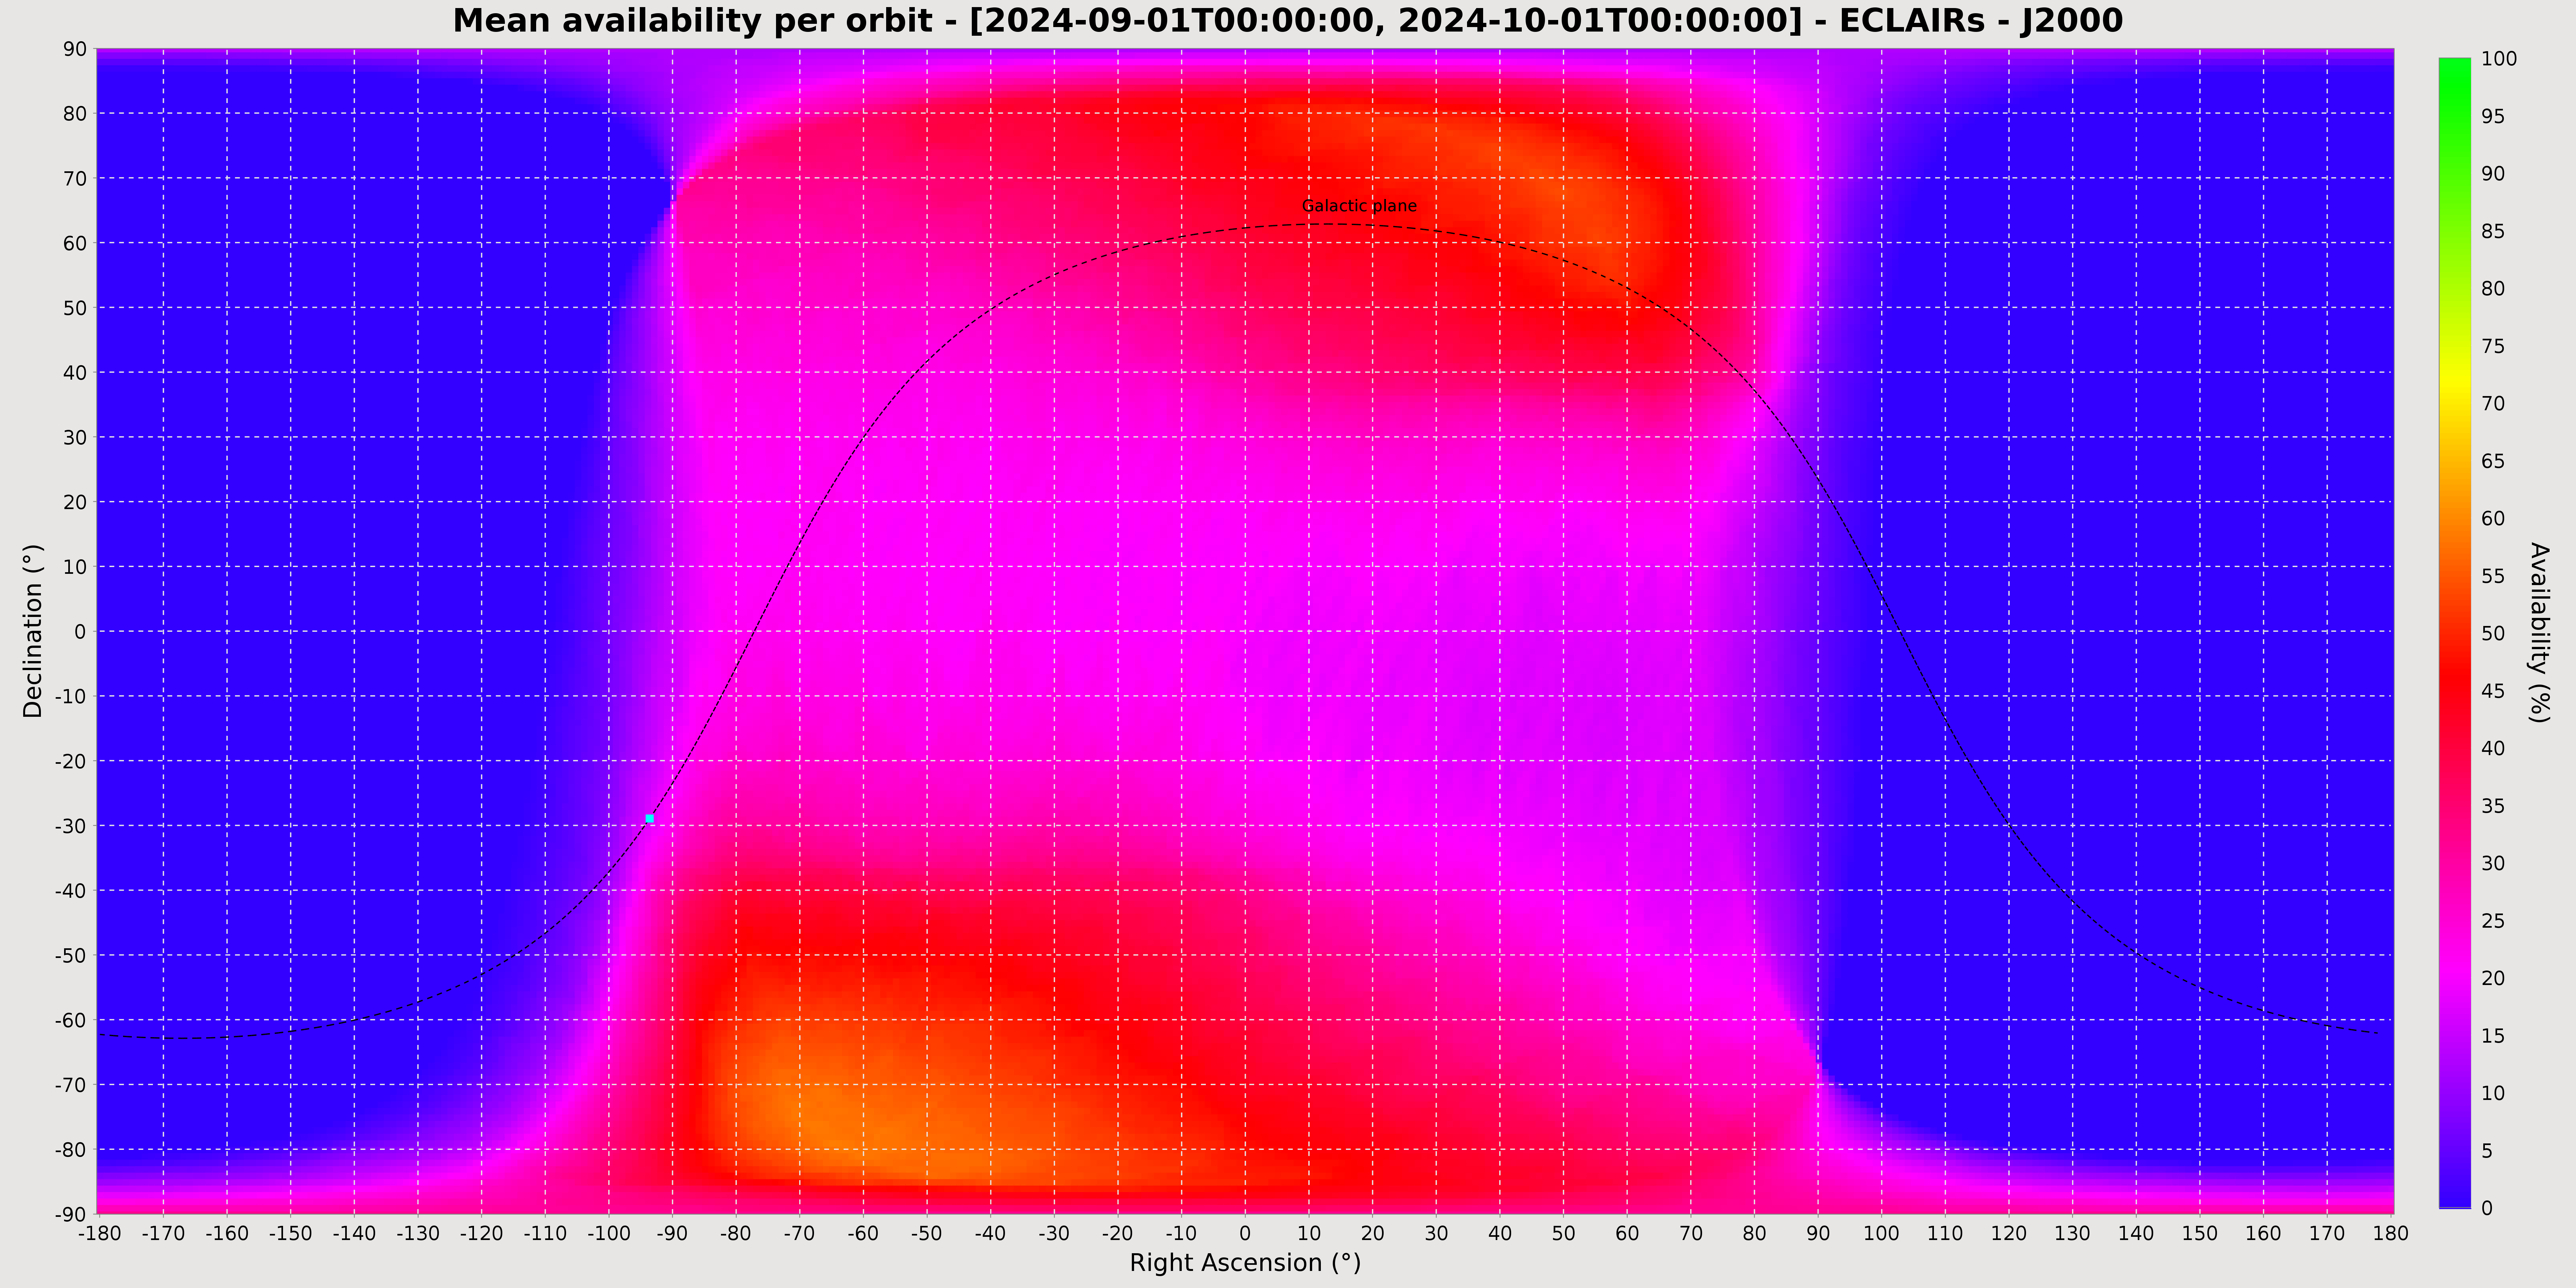
Secondly, it displays the same type of availability chart, but computed and averaged this time only over the chosen period and now,
considering also the Sun constraint. Other information can also be represented on this chart as galactic plane, orbit plane and poles. The corresponding image can be downloaded.
In the representation of the sky chart, J2000 Right ascensions or galactic longitudes are indicated from positive values on the left to negative values on the right in order to correspond to the natural observing view of the sky from Earth
Note: Some elements are represented either at the unique selected date or middle date of period or selected date for the quaternion depending on the options chosen.
Some optional additional results are presented below :
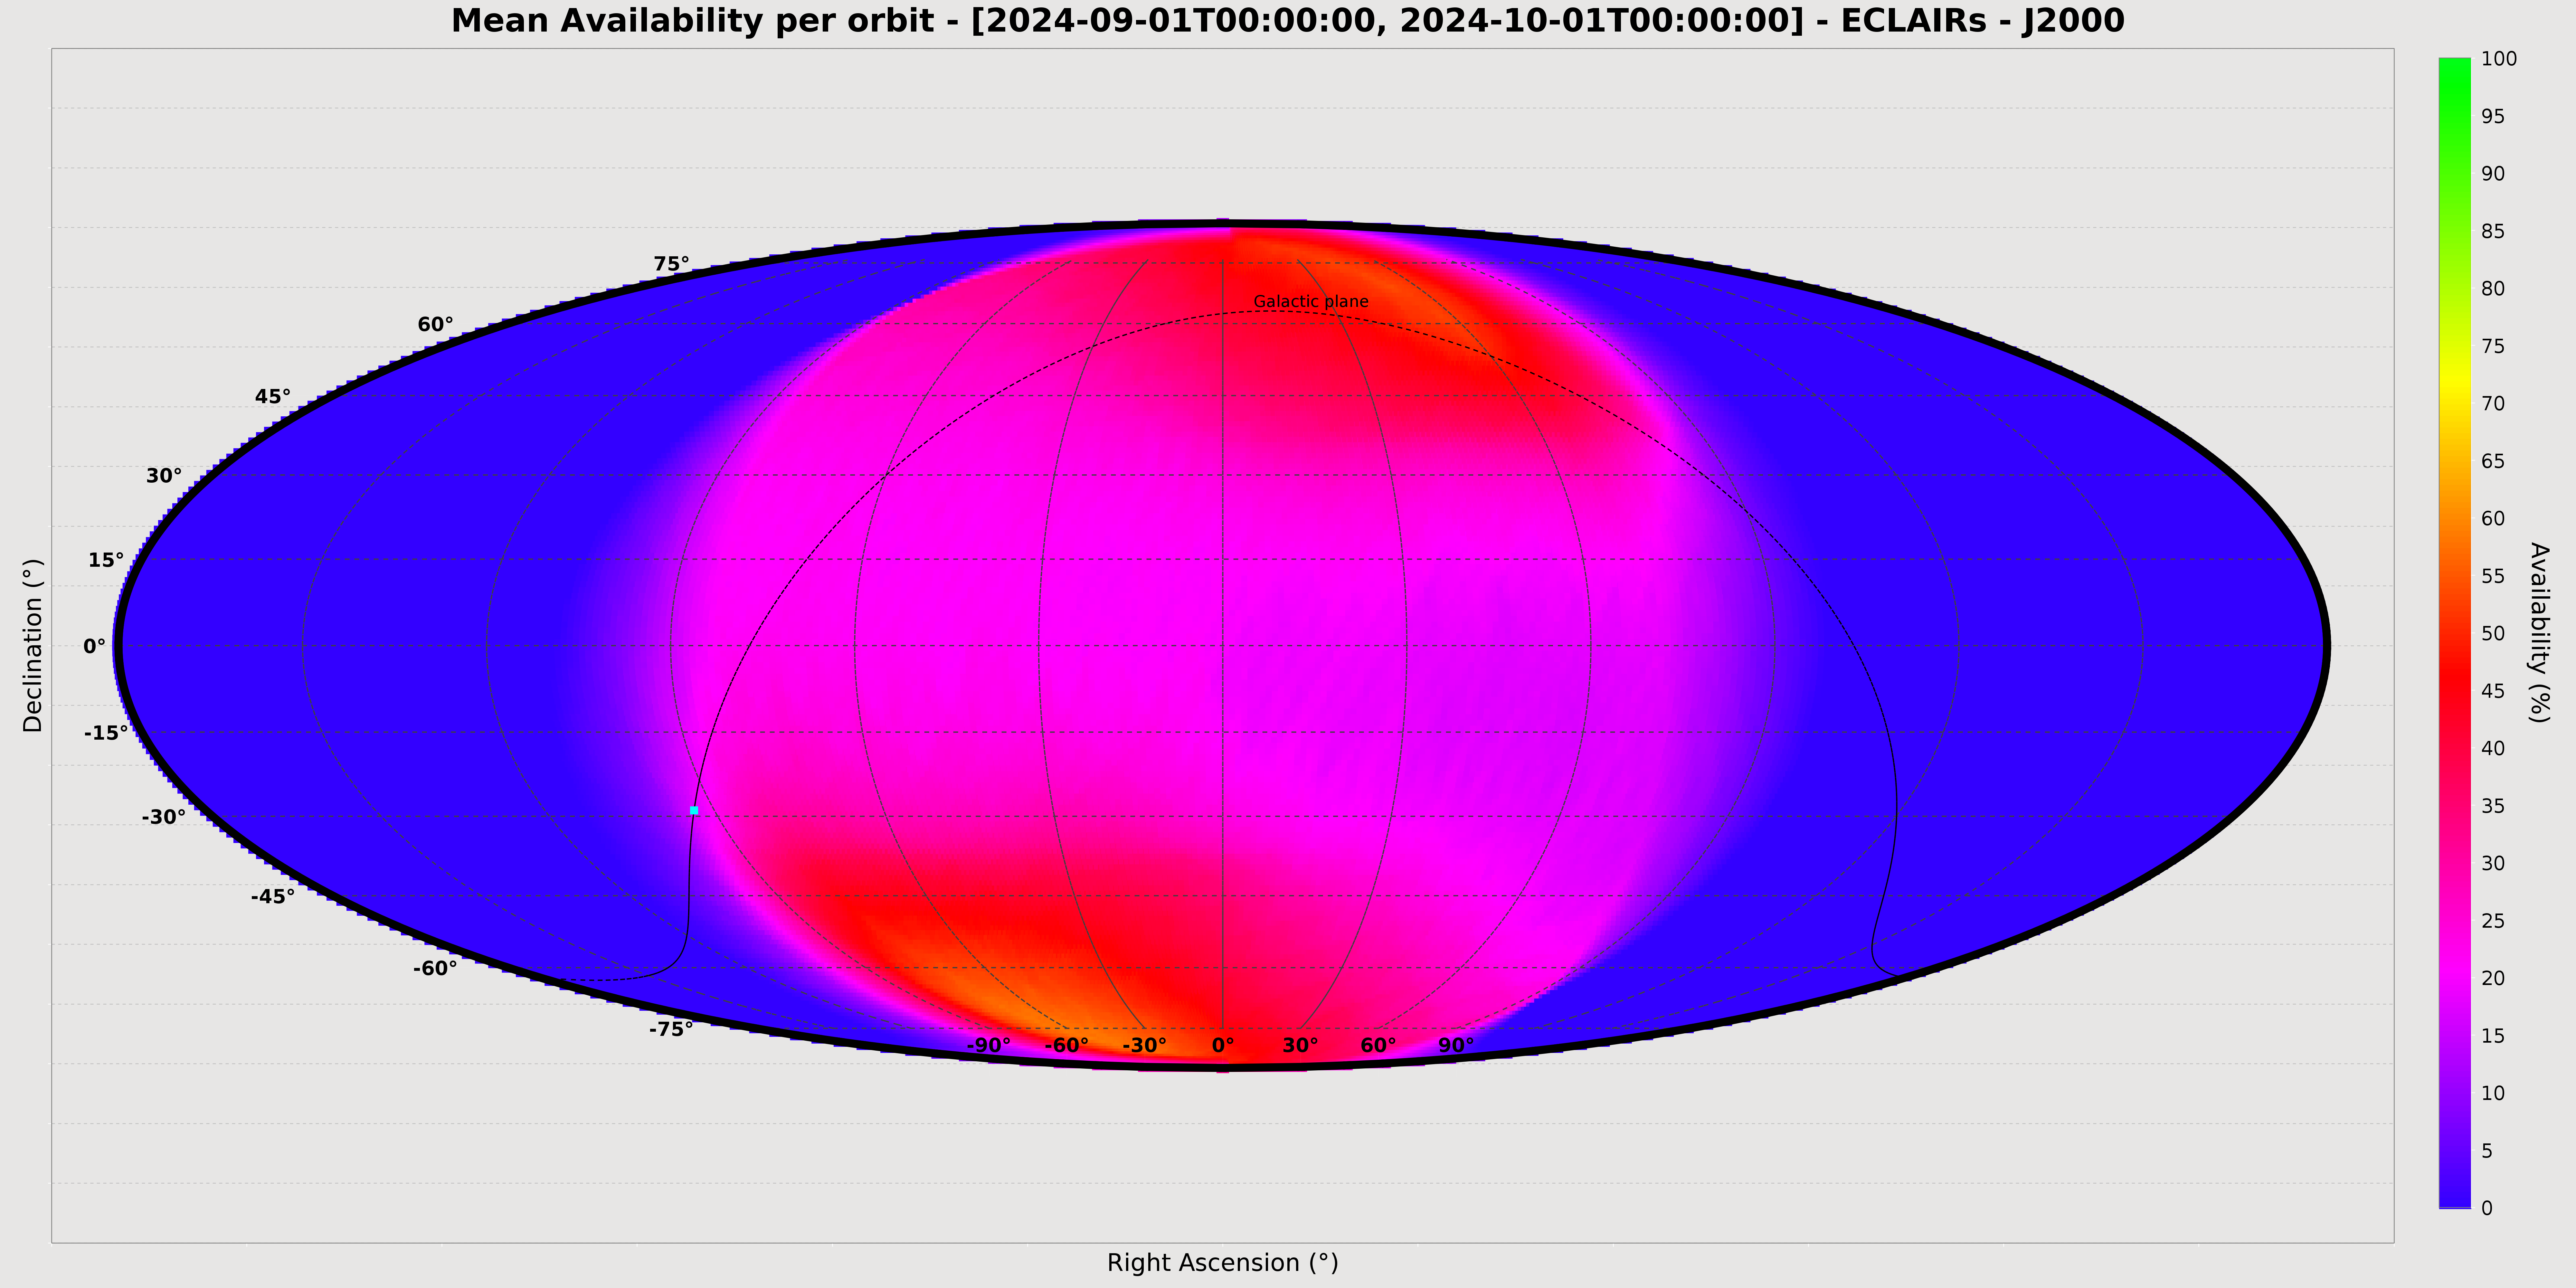
You can optionally get the chart in a Mollweide representation and equatorial J2000 coordinates.
You can also get the chart in a Mollweide representation and galactic coordinates.
Accessibility of list of sources
This section of the SSTOMP tool allows you to compute in a row a chart representing the availability of several sky sources during a given period and considering only the Sun and Moon constraints. Above all, the logic and purpose are
to give the user a quick overview of the opportunities to observe a set of sources over long periods (a few weeks, months, ...) and to identify their time intervals of accessibility. Then, with other tools and functions
proposed by SSTOMP, the observability assessment can be refined on shorter sub-periods to consider other constraints like SAA crossings or Earth occultations.
Note : depending on the inputs, the computation time can be relatively long.
The inputs
The input form uses again the general input boxes described in the General Information panel for orbit definition, instruments selection and a simplified version for the observation box with only fields related to the definition of the time period and time step having to be filled in. As for other tools, the choice of the instruments to consider will drive the assignment of worst case values of constraints to apply for the availability assessment, but here, as explained previously, only for Sun and Moon constraints.

The dedicated form implemented to let the user select the list of sky sources to be assessed is here mandatory with still two modes available : The default automatic mode proposes some default lists of sources related each to an instrument and that you can browse (click on the "HERE" button). The other mode which is the manual one allows you to download a template and then, to enter your own list of sources with the "Choose a file" button.

The Result Options box : : Here, there are two options. The first option relates to the production of a text file containing the detailed status of sources accessibility corresponding to the sampling of the period with the chosen time step.
Otherwise, the default setting is that the only start and end dates of accessibility or inaccessibility time intervals are provided for each source.
Second option relates to the presentation of data with the possible choice to get them in a "raw format". This means that the results produced in text files will not be formatted (with titles, tables and field names) in order to allow for an easier use with other applications if needed. The second one relates to the production of a text file containing the detailed numerical values corresponding to the chart.

The results
Firstly, as for other tools, the section shows a summary of the worst case constraints applied among those of instruments selected but here, only for Sun and Moon constraints (with indication of the limiting instrument).

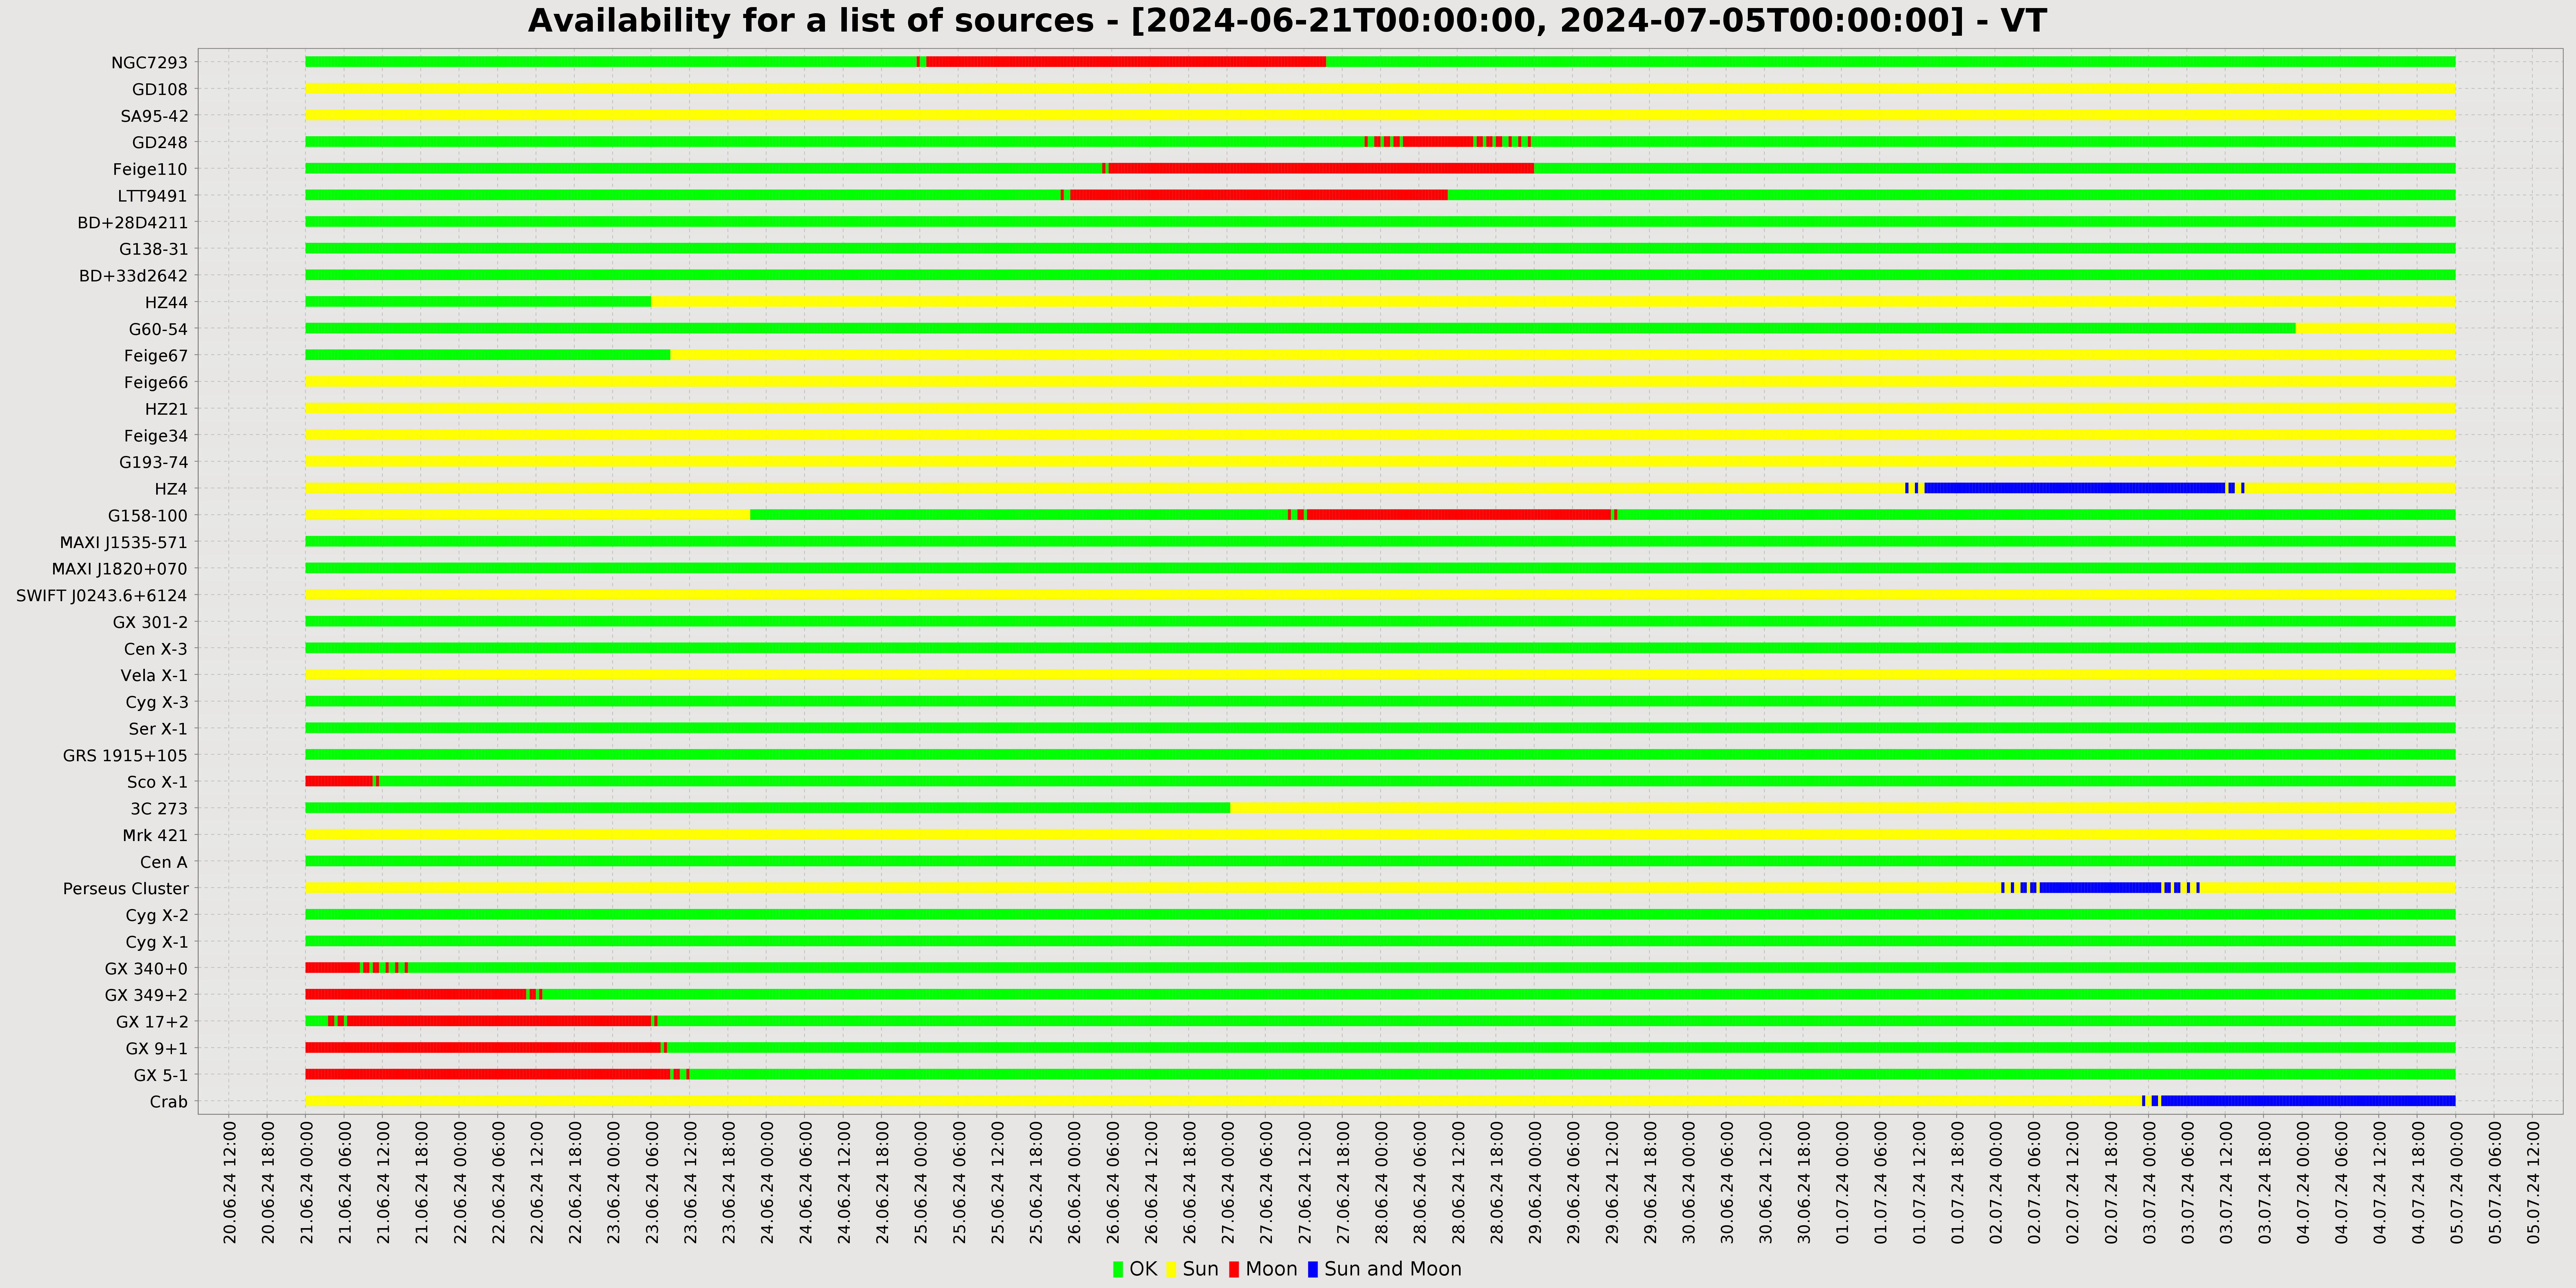
Secondly, the tool displays a chart computed from the input list of sky sources and period and showing at each date sampled and for each source, if it is observable or not depending on Sun or/and Moon constraints. The corresponding image can be downloaded. In addition, text files are also produced containing either the start and dates of accessibility or inaccessibility time intervals or the detailed numerical values corresponding to the chart (formatted or raw).
Important note : The chart is not produced if the number of input sources to proceed are too large (50 sources maximum).
